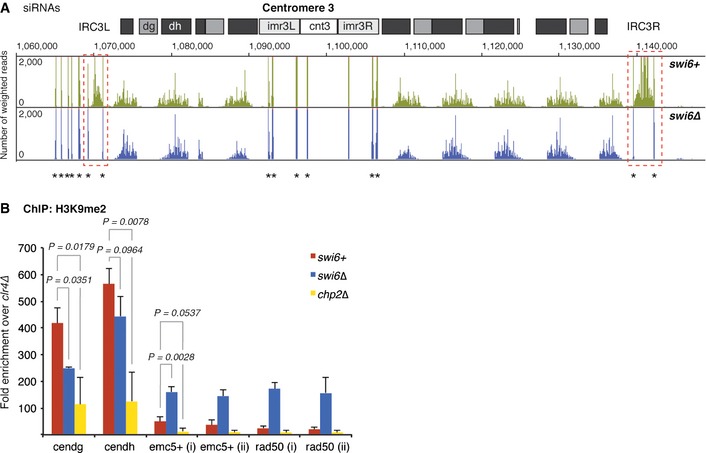
Figure EV4. siRNA levels and spreading of H3K9me at centromere 3 in the absence of Swi6.

- Small RNA reads mapping to centromere 3 in swi6+ (green) and swi6∆ (blue) cells. The dashed red box points out the loss of siRNAs mapping to IRC3 elements in the absence of Swi6. Centromeric repeat elements and the central core are indicated. Counts were normalized to the library size. Asterisks denote tRNA fragments. Note that tRNA genes flank IRC3 but not IRC1 (Fig 6).
- H3K9me2 levels on heterochromatin‐adjacent genes assessed by ChIP–PCR in swi6+, swi6∆, and chp2∆ cells. Enrichments over clr4∆ were normalized to adh1+. Average fold enrichment with s.d. is shown for three independent experiments. P‐values were generated by the Student's t‐test (two‐tailed distribution, two‐sample, unequal variance).
