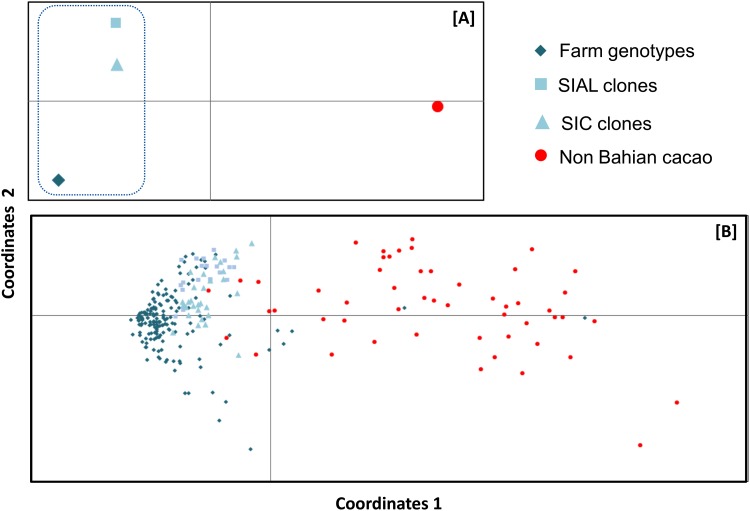
Fig 4. Bidimensional diagram based on a principal coordinate analysis (PCoA) of genotypic data from 30 microsatellite loci.
(A) PCoA for cacao groups and (B) PCoA for cacao plants. The dashed line differentiates the groups that are considered Bahian cacao, and the colors used to represent the groups and plants are based on the results from the STRUCTURE software analysis.

