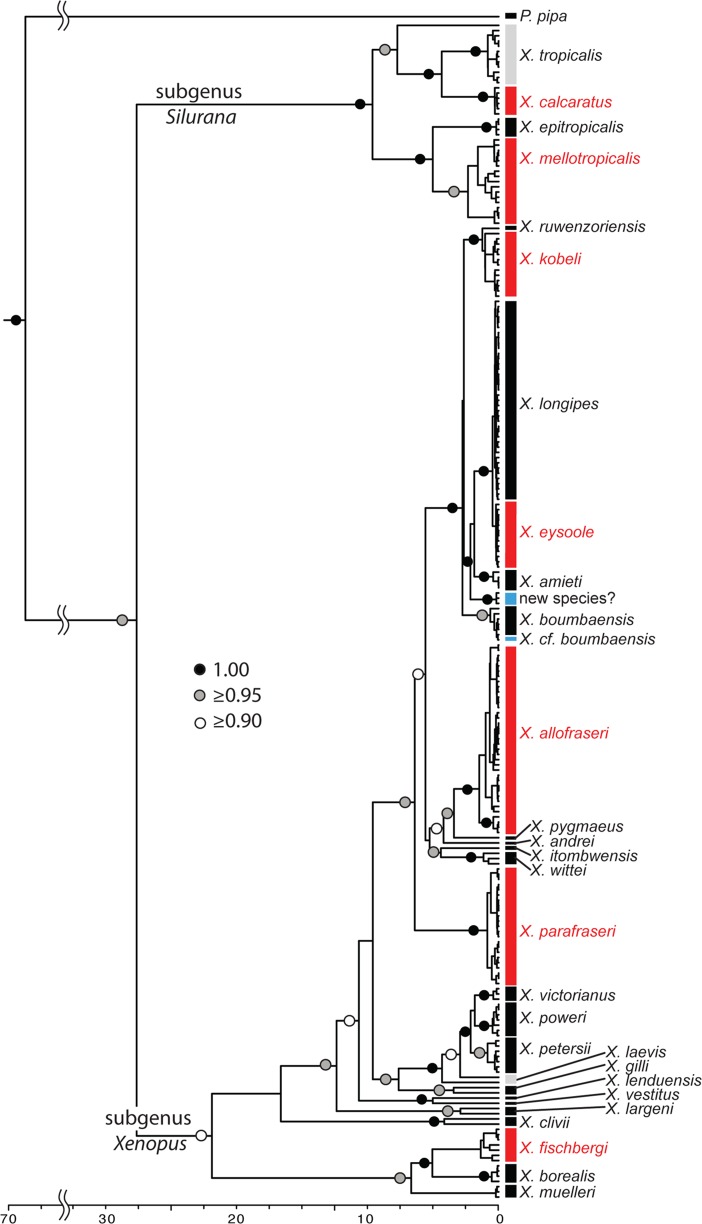
Fig 1. Mitochondrial DNA chronogram using calibration from [34].
New and resurrected species detailed here are indicated in red, possible additional new species are indicated with blue, and species with paraphyletic mtDNA are indicated with gray. Dots subtending nodes indicate posterior probabilities as indicated by the key with some values over terminal clades omitted for clarity. The scale is in units of millions of years.

