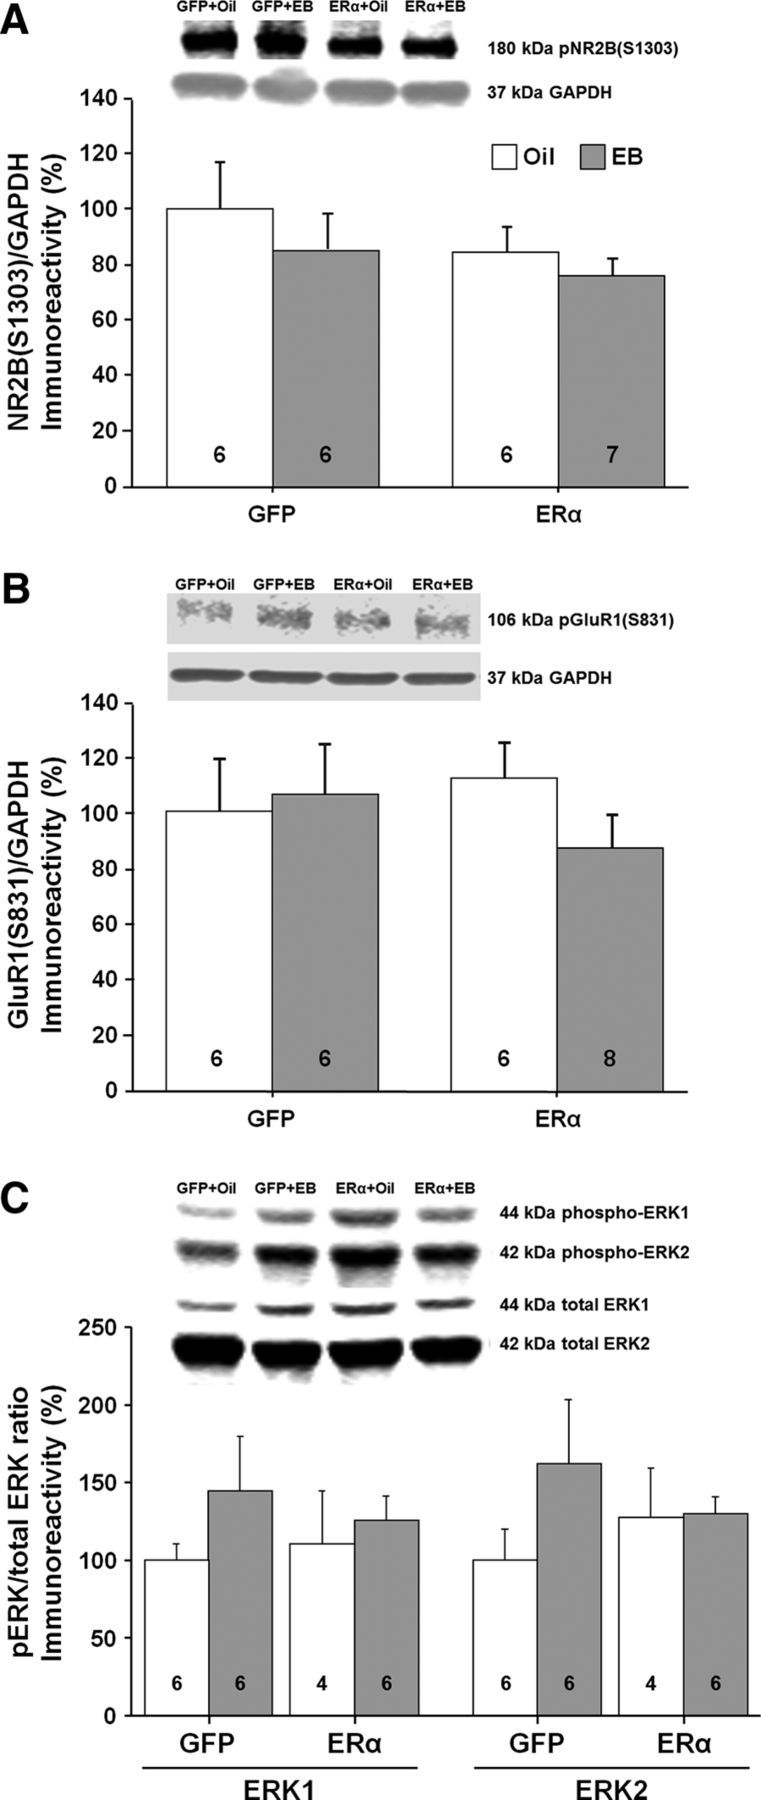
Figure 12.

Western blots to assess possible changes in phosphorylation and kinase activity in the CA1 region of the hippocampus for animals expressing ERα or GFP. The bars represent the means (±SEM) for the phosphorylation of NR2B at S1303 (A), GluR1 at S831 (B), and ERK1/2 (C).
