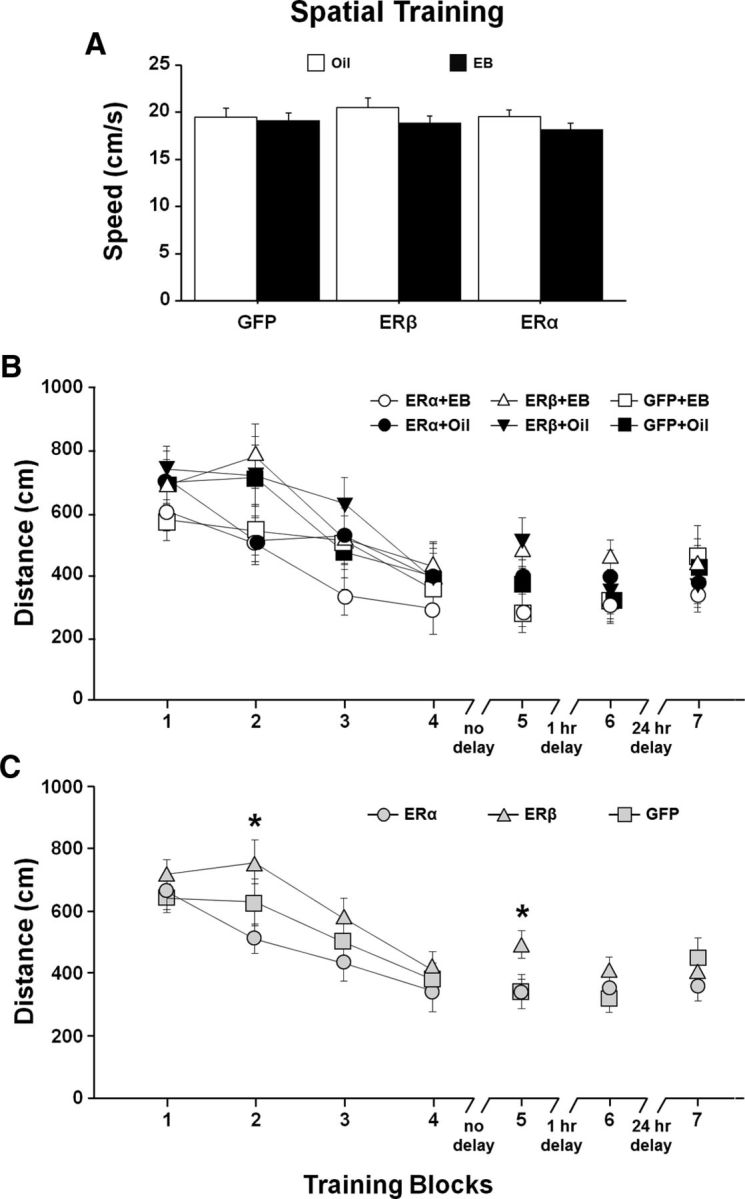
Figure 5.

Spatial discrimination performance after differential expression of ER and EB/oil treatment. A, Mean swim speed (+ SEM) across training Blocks 1–5 for EB (filled bars)- and oil (open bars)-treated animals. Symbols indicate the mean (±SEM). B, Escape path length to the submerged platform for the ER and treatment groups. C, Mean (±SEM) escape path length collapsed across EB/oil treatments (gray) for each ER group, illustrating the shortest and longest escape distances in ERα and ERβ groups, respectively. The asterisks indicate trial blocks during acquisition training with significant (p < 0.05) differences between ERβ and other groups.
