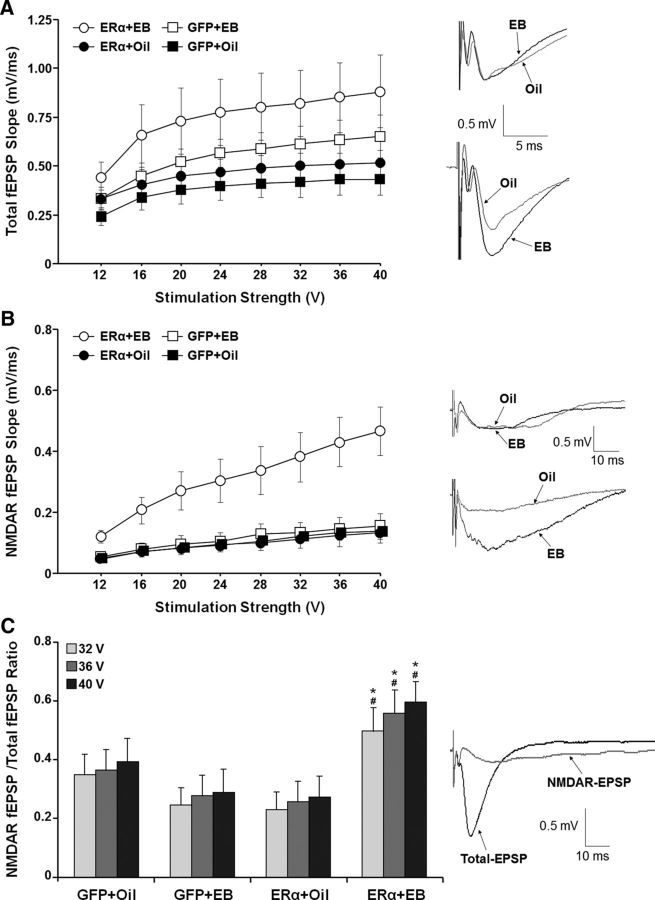
Figure 8.
Expression of ERα in conjunction with EB treatment enhanced the NMDAR-synaptic response in the hippocampus of aged female rats. Input–output curves are illustrated for the mean slope of the total-fEPSP (A) and NMDAR-fEPSP (B). EB treatment was associated with an increase in the total-fEPSP response, which was particularly evident for animals that received AAV-ERα. After collection of the total-fEPSP, the NMDAR component of the synaptic response was isolated. In contrast to the total-fEPSP, the EB-mediated increase in NMDAR-fEPSP was specific to animals that received AAV-ERα. The insets in A and B show representative traces of synaptic responses from animals injected with AAV-GFP (top) and AAV-ERα (bottom) and treated with EB (black line) or oil (gray line). C, The ratio of the NMDAR-fEPSP/total-fEPSP for the highest stimulation intensities (32–40 V) was increased in the ERα + EB group. Asterisks indicate significant (p > 0.05) treatment effect, with greater NMDAR-fEPSP/total-fEPSP ratio in the ERα + EB group relative to the ERα + oil group. Pound signs indicate a significant ER group effect with a greater NMDAR-fEPSP/total-fEPSP ratio in ERα + EB group relative to GFP + EB group. The inset shows the total-fEPSP and isolation of NMDAR-fEPSP from the same slice.

