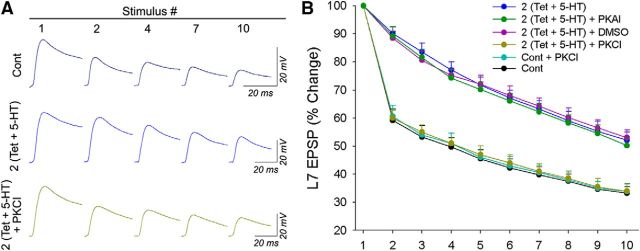
Figure 3.
PKC activity is required for the attenuated kinetics of HSD that accompany PA-LTF. Cultures were exposed to PKC inhibitor chelerythrine (PKCI; 10 μm) or PKA inhibitor KT5720 (PKAI; 10 μm) or received vehicle treatment for 30 min after recording the initial EPSP amplitude and before HSD stimuli on day 7. A, Sample traces of EPSPs at different stimulus numbers are compared for cultures treated with control (Cont), 2 (Tet + 5-HT), and 2 (Tet + 5-HT) + PKCI. The significant decline in EPSPs was absent at synapses treated with 2 (Tet + 5-HT). The decline observed with controls was comparable to that of synapses expressing PA-LTF plus incubation with chelelythrine. B, Summary of the changes in the kinetics of HSD. The kinetics of HSD were attenuated for cultures treated with 2 (Tet + 5-HT), 2 (Tet + 5-HT) + DMSO, and 2 (Tet + 5-HT) + PKAI, whereas treatment with PKCI [2 (Tet + 5-HT) + PKCI] reversed the attenuated kinetics produced by 2 (Tet + 5-HT) so that it was not different from those observed in the control and Cont + PKCI groups. A two-factor ANOVA indicated a significant effect on the kinetics of HSD (F(40,280) = 4.047; p < 0.001). Individual comparisons showed that the attenuated kinetics of HSD in 2 (Tet + 5-HT), 2 (Tet + 5-HT) + DMSO, and 2 (Tet + 5-HT) + PKAI were not significantly different from each other (F values between 0.419 and 1.447; all p values >0.15) but were significantly different from those in 2 (Tet + 5-HT) + PKCI (F = 6.506, p < 0.001; F = 2.474, p < 0.02; F = 7.182, p < 0.001), control (F = 9.873, p < 0.001; F = 4.072, p < 0.001; F = 15.436, p < 0.001), or Cont + PKCI (F = 7.262, p < 0.001; F = 2.886, p < 0.008; F = 11.078, p < 0.001). Treatments that did not attenuate HSD kinetics were not significantly different from each other (F values between 0.063 and 0.101; all p values >0.9).

