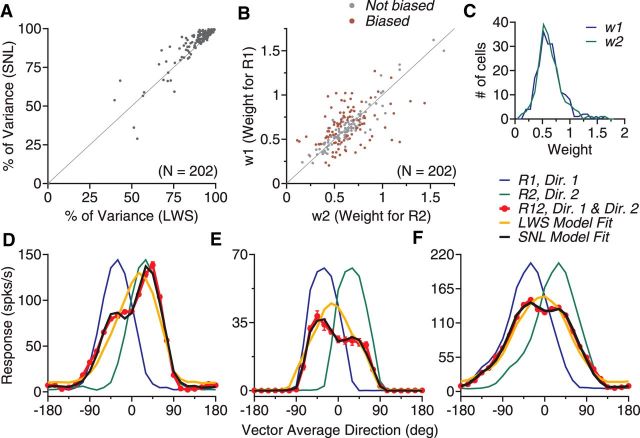
Figure 2.
Model fits of the response tuning curves elicited by bidirectional stimuli separated by 60°. A, PV accounted for by the LWS and the SNL model. B, Weights for the component responses obtained using the SNL model fit. Each dot in A and B represents data from one neuron. Colored dots in B indicate that the two response weights are significantly different. C, Distribution of the response weight for each stimulus component. D–F, Direction tuning curves and their model fits of three example neurons. These neurons are the same as those shown in Figure 1B–D.

