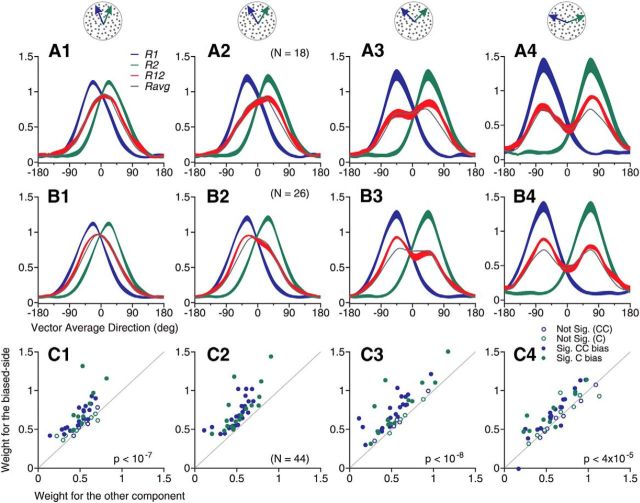
Figure 4.
Consistent side bias of response tuning curves across different angular separations. A, Averaged response tuning-curves across 18 neurons that showed side bias to the C-side component of the bidirectional stimuli separated by 60°. B, Averaged response tuning curves across 26 neurons that showed side bias to the CC-side component of the bidirectional stimuli separated by 60°. The width of each curve indicates SE. C, Response weights obtained using the SNL model fit for the combined 44 neurons that showed side bias to the bidirectional stimuli separated by 60°. The “biased-side” in the ordinate was determined by the response to 60° DS. Each dot represents data from one neuron. Solid dots indicate that the response weight for one stimulus component was significantly greater than the other component (permutation test, p < 0.05). The mean weight for the component response to the “biased-side” defined at 60° DS was significantly greater than the weight to the other stimulus component at angular separations of 45°, 90° and 135°. p-values are the results of one-tailed paired t test. A1–C1, 45° DS; A2–C2, 60° DS; A3–C3, 90° DS; A4–C4, 135° DS. Note that we allowed the side-biased neurons to have either a single response peak or two response peaks in this analysis.

