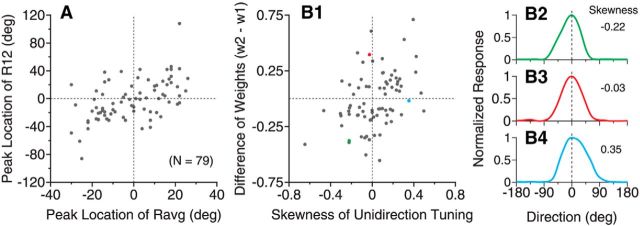
Figure 5.
Relationship between the shapes of response tuning curves to bidirectional and unidirectional stimuli. The results were from 79 neurons that showed side bias in their tuning curves to the bidirectional stimuli separated by 60°. A, Relationship between the peak locations of the response tuning to the bidirectional stimuli R12 and the average of the responses elicited by individual stimulus components Ravg = (R1 + R2)/2. The peak location is represented as the VA direction of the bidirectional stimuli. B1, Relationship between the difference of the response weights for the two stimulus components obtained from the SNL model fit of R12 and the skewness of the unidirectional tuning curve (see Materials and Methods). w2 and w1 correspond to the response weights for Dir. 2 and Dir. 1, respectively (Fig. 1 diagram). B2–B4, Response tuning curves to the unidirectional stimuli of three neurons that had negative (B2), near zero (B3), and positive skewness (B4). These neurons are marked in B1 using the corresponding colors. The neuron shown in B3 is the same example neuron shown in Figure 1B.

