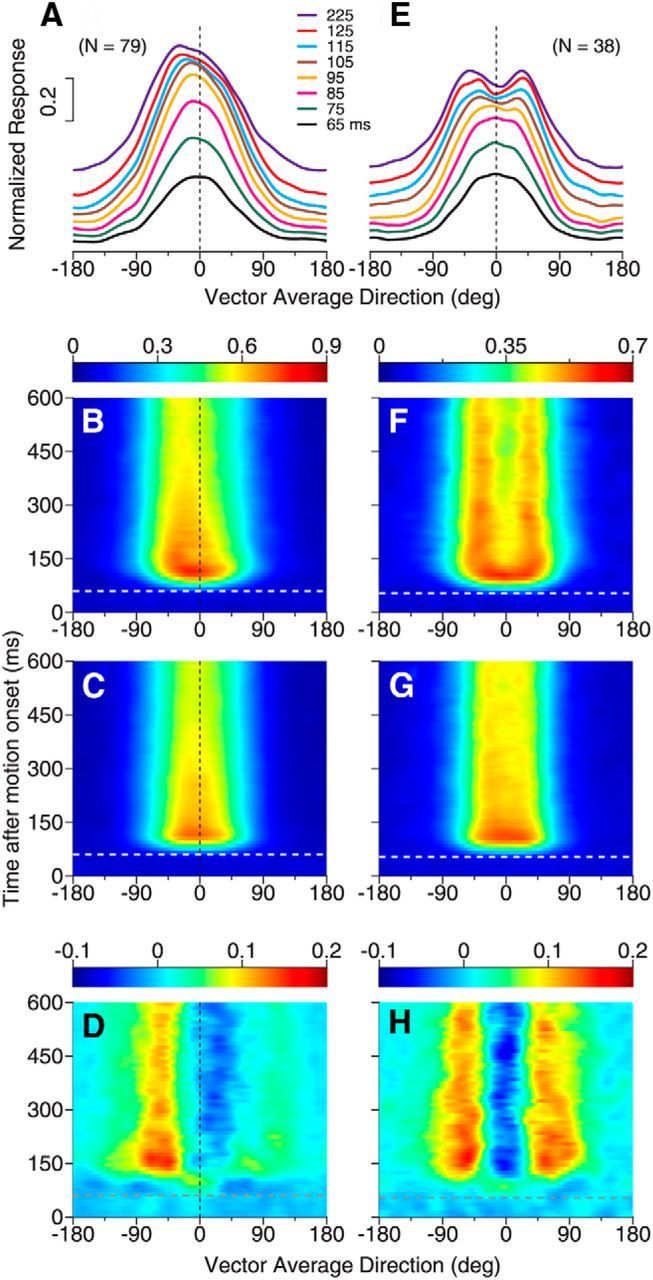
Figure 6.

Time course of response tuning to bidirectional stimuli separated by 60°. A–D, Responses of neurons showing side bias to bidirectional stimuli. E–H, Responses of neurons showing two peaks to bidirectional stimuli. A, E, Subpopulation-averaged response tuning curves to bidirectional stimuli at different time epochs after the stimulus motion onset. The duration of each time epoch is 50 ms. The tuning curves of later epochs are stacked on earlier ones. The number in figure legends indicates the middle point of each time epoch. B, F, Time course of the subpopulation-averaged response tuning to bidirectional stimuli (i.e., R12). Ordinates indicate the middle point of each time epoch. C, G, Time course of the average of the component responses (i.e., Ravg), averaged across neurons in each subpopulation. D, H, Difference between the response to bidirectional stimuli shown in B and F and the average of the component responses shown in C and G, respectively. In A–C, we pooled the results from neurons that showed side bias to the component directions at the C-side (i.e., Dir. 2) and CC-side (i.e., Dir. 1) together by first flipping the bidirectional and unidirectional tuning curves of neurons that showed the side bias to Dir. 2 along the axis of VA direction 0°. The white and gray horizontal lines in B–D and F–H indicate the neuronal response onset to the stimulus motion. In D and H, the deviation from the average of the component responses emerged later than the neuronal response onset.
