
Figure 5.
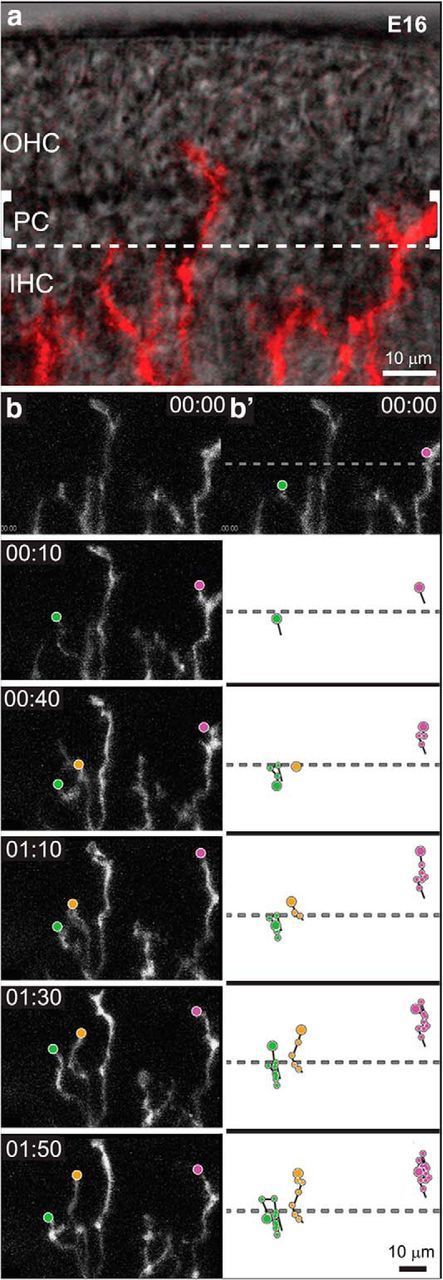
Time-lapse imaging of SGN processes reveals a variety of behaviors within IHC and OHC regions. a, An overlay of bright-field and fluorescent images illustrates the position and morphology of SGN processes (red) in a cultured E16 Neurog1-CreERT2;AI14 cochlea at the start of imaging. Pillar cells (PC) separate the IHCs from the developing OHCs. SGN peripheral process trajectories were analyzed in the IHC or OHC region, using the PC to delineate the border (dashed lines). b, A montage of frames reveals the types of movement exhibited by SGN processes over several hours of development (Movie 3; time is displayed as hours:minutes). Trajectories were constructed by marking the position of each tip (dots) in successive frames. Processes exhibited a variety of behaviors. For instance, the process illustrated in green crosses the PC border, but then retracts back to the IHC region; a nearby process advances steadily away from the modiolus (yellow); and a process already in the OHC region makes only short movements that result in little net movement (magenta). Scale bars, 10 μm.