
Figure 7.
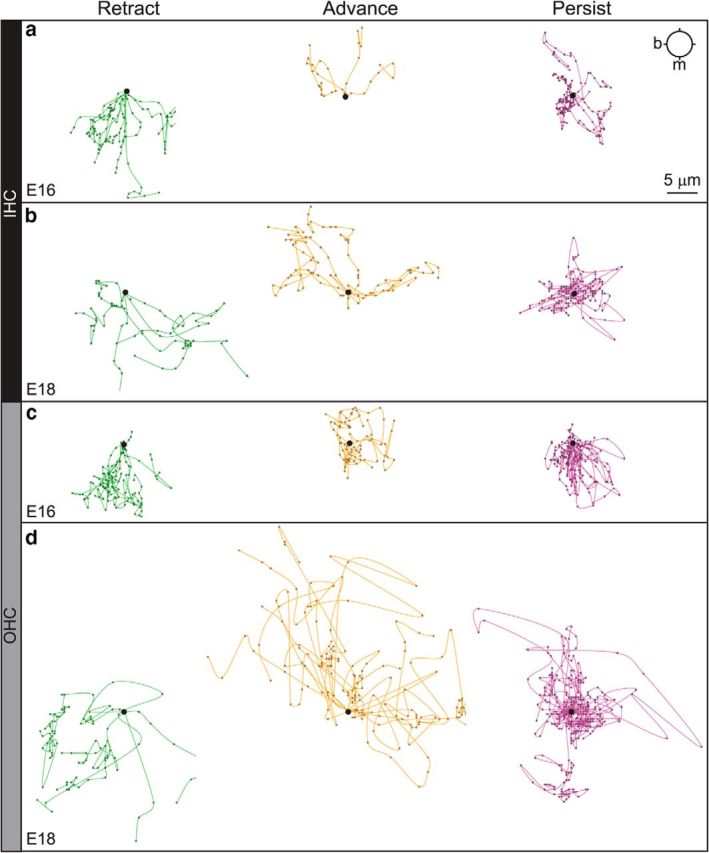
SGN processes follow different paths within each region that change over time. Origin plots for the same tracks shown in Figure 6, further separated into groups based on net distance and end-point. Specifically, the mean distance to origin (DTO) for each group was calculated, and any track below the mean was classified as persistent. Tracks above the mean DTO were classified as retracting if their end-point was modiolar to their start-point. Similarly, advancing tracks had above average DTO and an end-point amodiolar to the start. At E16 (a, c), instantaneous withdrawals toward the modiolus were common in those tracks that ultimately retracted in both the IHC-region (a, green) and OHC-region (c, green), as well as those that persisted in the OHC-region (c, magenta), suggesting that even those processes that did not move far from the origin made frequent retractive movements. Advancing processes in the IHC region appeared directed (a, yellow), especially relative to those in the OHC region (c, yellow). At E18 (b, d), movements in the IHC-region (b) seemed less directed, with more lateral extensions in the Retract (b, green) and Advance (b, yellow) groups and a high density of movements about the origin in the Persist group (b, magenta). In the OHC-region, the occasional Retracting process (d, green) moved very quickly and directly toward the modiolus. Processes in the Advance group (d, yellow) made rapid movements away from the modiolus, often biased toward the base. Processes in the Persist group (d, magenta) circled the origin, with more movements pointed amodiolar and/or toward the base than at E16, when retractive movements clearly dominated (c, magenta). Base (b) is to the left; the modiolus (m) is toward the bottom. Scale bar, 5 μm.