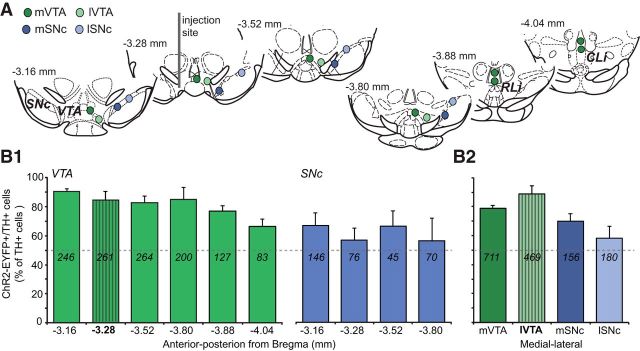
Figure 2.
Distribution of ChR2-EYFP transduced dopamine neurons in the VTA and SNc. A, Schematics, adapted from Paxinos and Franklin (2001) here and in subsequent figures, show the locations where confocal images were acquired for cell counts in the medial (mVTA; dark green circles), lateral VTA (lVTA; light green circles), medial SN (mSN; dark blue circles), and lateral SN (lSN; light blue circles). The dark gray bar in the slice at −3.28 mm from bregma shows the viral vector injection site in the lVTA. B, Transduction efficacy is expressed as the percentage of ChR2-EYFP+ cells among TH+ cells. Numbers within the bars correspond to the total number of cells counted at each location (n = 4 mice). Gray dashed lines indicate 50% efficacy. B1, Along the anterior–posterior axis in the VTA (green bars) and SNc (blue bars), high transduction efficacy was seen in the VTA and lower in the SNc at all anterior–posterior levels. B2, Transduction efficacy decreased from medial to lateral ventral midbrain. The striped bars indicate the location of the injection site.

