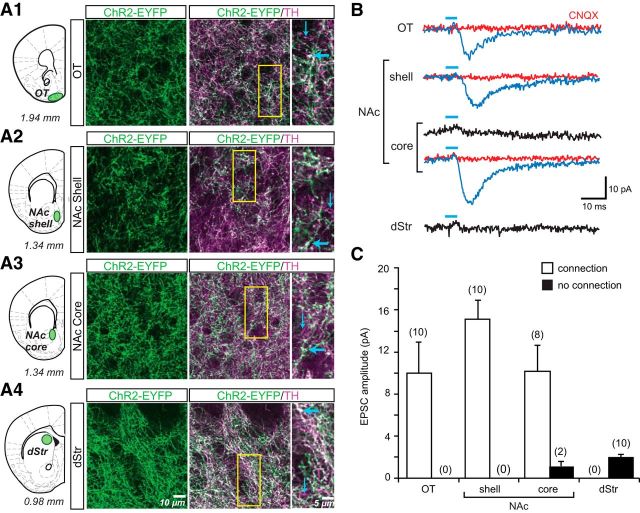
Figure 3.
ChR2-EYFP expression in dopamine neuron axons and photostimulated glutamatergic responses in the striatum. A, Confocal immunofluorescence images of ChR2-EYFP+ and TH+ axons in the OT (A1), NAc shell (A2), NAc core (A3), and dStr (A4) are shown. Schematics (right) show the coronal slices, with distance from bregma indicated below each section, that were used for immunostaining and in vitro EPSC recordings; sites of image acquisition and recording are outlined in green. The three columns of images show ChR2-EYFP+ axons (green), the merge of ChR2-EYFP+ (green) with TH+ (magenta) to reveal ChR2-EYFP+/TH+ (white) axons and expanded images of the regions of interest (yellow rectangle, middle column). Thick blue arrows indicate ChR2-EYFP+/TH+ axons; thin blue arrows indicate ChR2-EYFP−/TH+ axons. No ChR2-EYFP+/TH− axons were seen in the striatum. B, Recordings were made from SPNs in the four sites in the striatum. EPSCs shown are the average of 10 consecutive traces. Traces with significant light-evoked responses are shown in blue; those without responses are shown in black. Blue bars above traces indicate photostimulation (5 ms pulses, at 0.1 Hz). CNQX (40 μm) completely blocked light-evoked EPSCs (red traces). C, Summary of the amplitudes of recorded light-evoked EPSCs in different regions of the striatum. The graph shows the average amplitudes in SPNs with EPSCs (connection; white bars) and without (no connection; black bars). The number of cells recorded is shown in parentheses.

