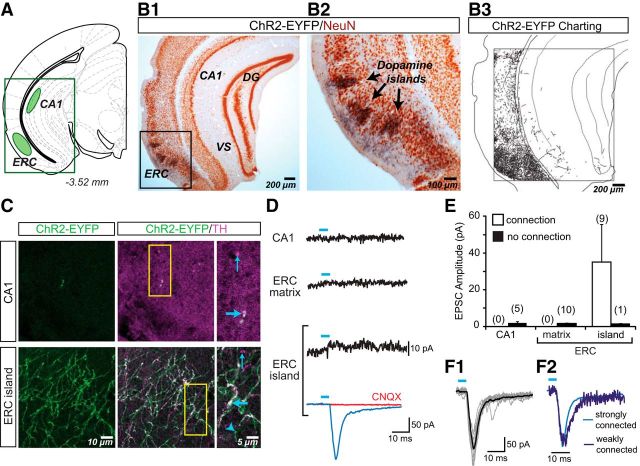
Figure 5.
ChR2-EYFP expression in dopamine neuron axons and glutamatergic responses in the hippocampal formation. A, Schematic shows the hippocampal formation brain slice used for immunostaining and in vitro EPSC recordings; sites of image acquisition and recording are outlined in green. B, Two-color immunoperoxidase staining of ChR2-EYFP+ axons (black) and the neuronal marker NeuN (brown). The region of interest centered on dopamine islands in the ERC (B1) is expanded to the right (B2). Charting of ChR2-EYFP+ axons revealed densely aggregated dopamine neuron axons in the ERC (B3) and sparse innervation in the VS, DG, and CA1 subregions. C, Confocal immunofluorescence images of ChR2-EYFP+ and TH+ axons in the hippocampal formation. The three columns of images show ChR2-EYFP+ axons (green), the merge of ChR2-EYFP+ (green) with TH+ (magenta) to reveal ChR2-EYFP+/TH+ (white) axons, and expanded images of the regions of interest (yellow rectangles, middle column). Thick blue arrows indicate ChR2-EYFP+/TH+ axons; thin blue arrows indicate ChR2-EYFP−/TH+ axons; arrowheads indicate ChR2-EYFP+/TH− axons. In the CA1 (top images), ChR2-EYFP+/TH+ axons were very rare. In contrast, in the ERC dopamine islands (bottom images), ChR2-EYFP+ axons were relatively abundant. D, Recordings from principal neurons in the hippocampal subregions. EPSCs shown are the average of 10 consecutive traces. The trace with a significant light-evoked response is shown in blue; those without responses are shown in black. Blue bars above traces indicate photostimulation (5 ms pulses, at 0.1 Hz). CNQX (40 μm) completely blocked the light-evoked EPSC (red trace). E, Summary of the amplitudes of recorded light-evoked EPSCs in the hippocampal subregions shows the average amplitudes in cells with EPSCs (connection; white bars) and without (no connection; black bars). The number of cells recorded is shown in parentheses. Only ERC island cells showed light-evoked EPSCs. F1, Individual EPSCs for the strongest ERC connection (10 traces are shown) reliably and tightly superimposed on the averaged EPSC. F2, Two superimposed traces normalized for peak amplitude, one from a strongly connected cell (light blue; EPSC amplitude of 197 pA) and another from a weakly connected cell (dark blue; EPSC amplitude 17 pA) show identical rise times, confirming that the responses were monosynaptic.

