Figure 7.
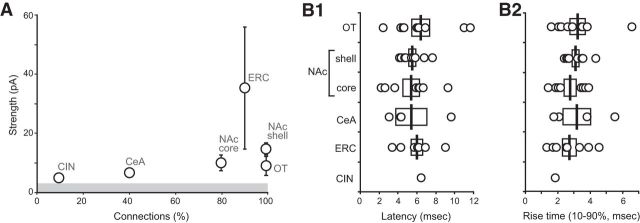
Comparison of the strength and timing characteristics of dopamine neuron glutamatergic EPSCs. A, Scatter plot showing the relationship between the incidence of connections (ratio of cells with connection of 10 recorded cells) and the connection strength (average amplitude of EPSCs in cells with connections) for each projection area. The gray bar indicates the average detection threshold (3.99 ± 0.29 pA) for connections in all recorded forebrain areas with connections. B, Distribution of latencies of glutamatergic responses (B1) and rise times (B2) for the regions with connections. Latency was short and both latency and rise time were tightly distributed, consistent with monosynaptic connectivity.

