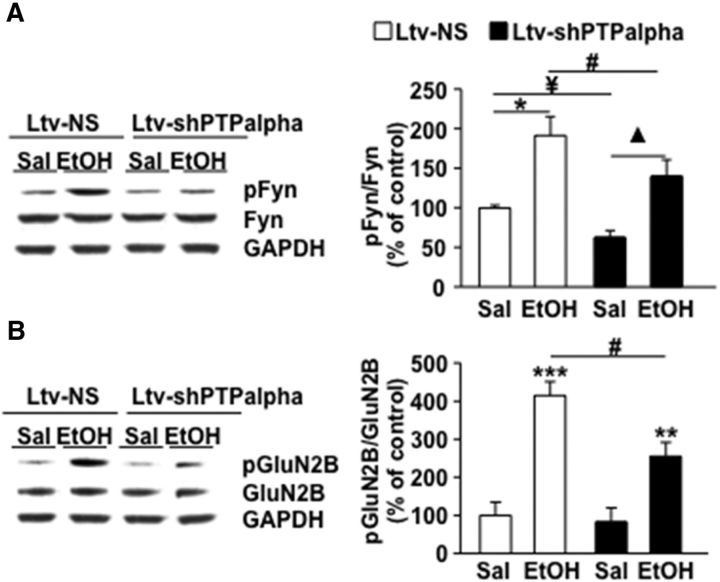
Figure 7.
Ethanol-mediated Fyn activation and GluN2B-NMDAR phosphorylation in response to ethanol treatment and PTPα knockdown. Mice were infused with Ltv-NS or Ltv-shPTPα in the dorsomedial striatum, DMS. Four weeks after the virus infusion, animals were treated with an acute administration of saline (Sal) or ethanol (EtOH, 2.5 g/kg, i.p.) and the DMS was collected 15 min later. Anti-[pY418/420]Src/Fyn and anti-Fyn antibodies (A) and anti-[pY1472]GluN2B and anti-GluN2B antibodies (B) were used to detect the phosphorylated form and the total amount of Fyn and GluN2B. Optical density of immunoreactivity of the phosphorylated-protein bands was normalized to total protein and plotted as percentage of Ltv-NS/saline treatment. (A) *p < 0.001 Ltv-NS/EtOH versus Ltv-NS/Sal. ▴p < 0.001 Ltv-shPTPα/EtOH versus Ltv-shPTPα/Sal. ¥p < 0.001 Ltv-shPTPα/Sal versus Ltv-NS/Sal. #p = 0.05 Ltv-shPTPα/EtOH versus Ltv-NS/EtOH. (B) **p < 0.01, ***p < 0.001 versus Ltv-NS/Sal and #p < 0.05 versus Ltv-NS/EtOH. n = 8–10 for each group.

