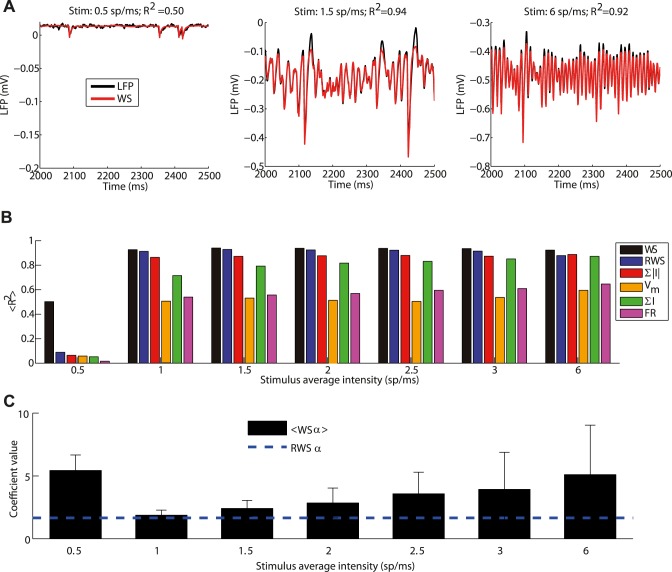
Fig 10. Effects of modulation of inputs with conductance-based synaptic model.
(A) LFP (black line) for 150 μm depth position when the stimulation frequency was 0.5 spikes/ms (left), 1.5 spikes/ms (middle), 6 spikes/ms (right) and corresponding best fit with WS proxy (red). The depth was the one for which WS proxy performance was highest. The titles indicate the fraction of variance explained. Note the different vertical scales. (B) Average fraction of LFP variance over all depths explained by different proxies for different thalamic inputs. Error bars are not displayed since they would not be visible in the figure. Same proxy arrangement as in Fig 5C. (C) Mean and standard deviation across depths of optimal coefficients of α in the WS proxy as a function of thalamic input. Dashed line indicates the fixed coefficient of the RWS proxy.

