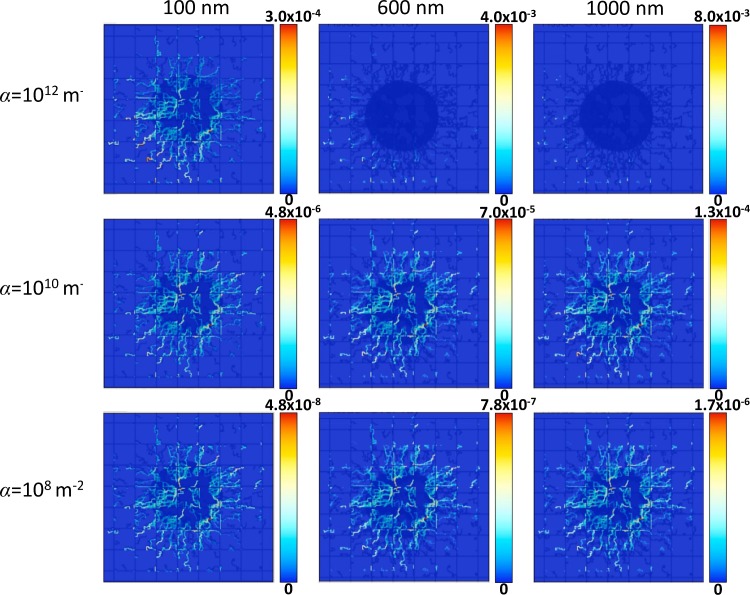
Fig 2. Distribution of vasculature-bound NPs immediately after injection overlaid with the tumor (dark blue shadow) and vasculature (dark blue lines).
NP concentration is in dimensionless units, with red indicating highest local value and dark blue indicating lowest. The columns denote different NP sizes, namely 100, 600 and 1,000 nm, while the rows denote different values for the parameter α in the tumor-induced neovasculature (α = 1012 m-2 top row; α = 1010 m-2 middle row and α = 108 m-2 bottom row). For all cases, β = 10−4 m-2 s while α for the pre-existing vessels is 100X smaller than for the neovasculature. Field of view for each panel is 2 x 2 mm.

