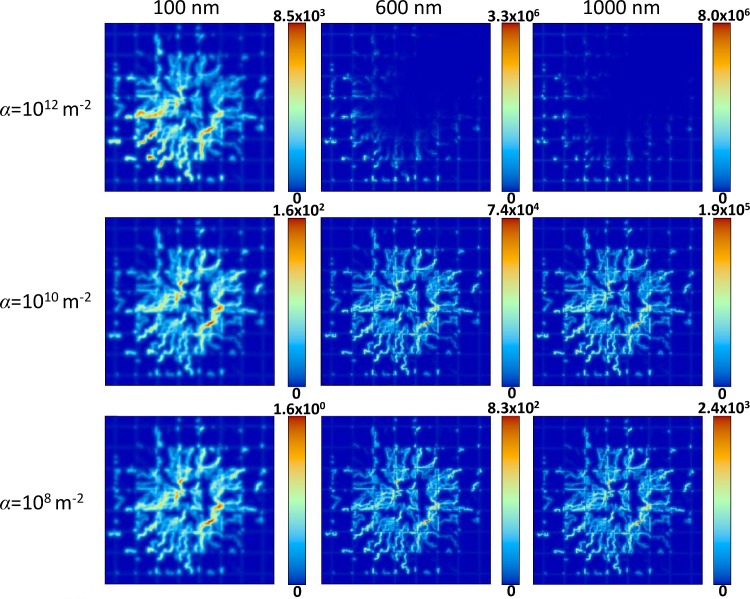
Fig 3. Distribution of drug released by NPs 24 hours after NP injection.
Drug concentration is in dimensionless units, with red indicating highest local value and dark blue indicating lowest. Columns and rows denote the same conditions as in Fig 2. Field of view for each panel is 2 x 2 mm.

