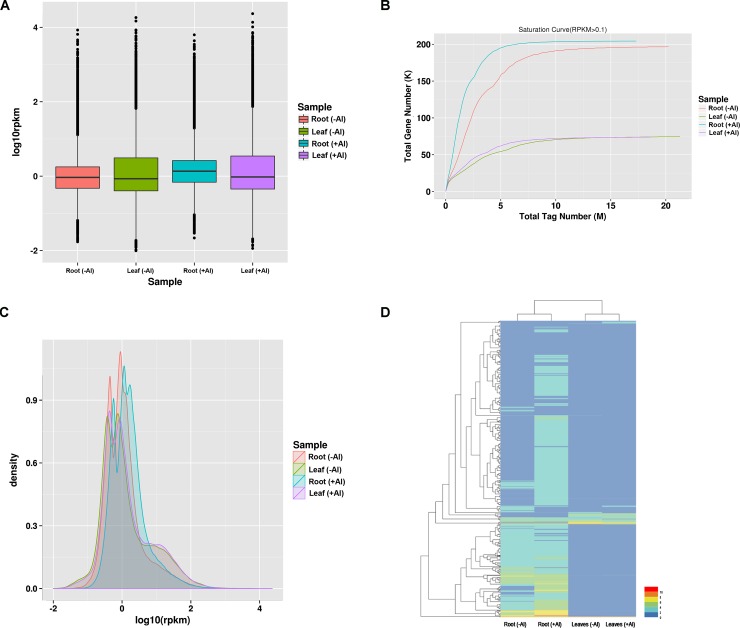
Fig 2. The overview of differential expression between no Al and Al stress in roots and leaves in hydrangea.
(A) Boxplots of the DEGs in the four samples; (B) Sequencing saturation level analysis of DEGs in the four samples; (C) Density distribution of the differentially expressed genes (DEGs) in the four samples; (D) heat map of the DEGs in roots and leaves between Al(-) and Al (+).

