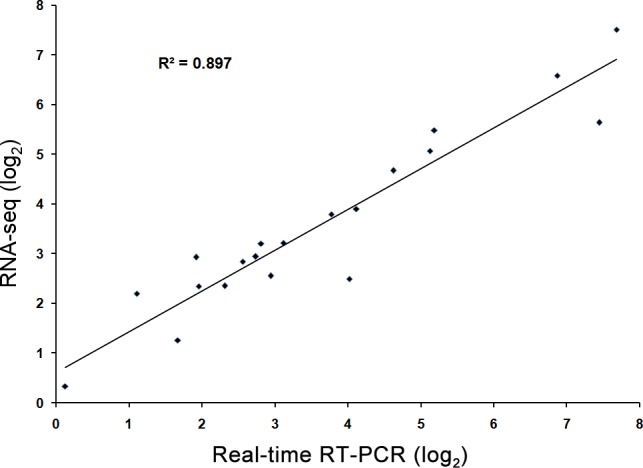
Fig 6. Validation of the expression data from RNA-seq analysis via quantitative real-time RT-PCR (qPCR) analysis.

Twenty genes exhibiting diverse expression profiles in the RNA-seq data were chosen for qPCR analysis. Average value of each RNA-seq expression data was plotted against that from qPCR and fit into a linear regression. Both x- and y-axes were shown in log2 scale.
