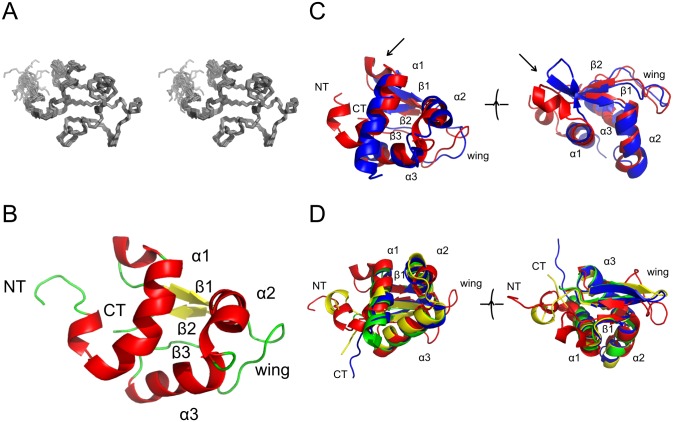
Fig 1. Structure determination of rat ABD2.
A: Stereo view of the family of the best 20 structures superimposed on the lowest energy structure. B: Secondary structure of the lowest energy structure in the same orientation as in A. Key structural features are labeled, helices are coloured red and strands are coloured yellow. C: Structural superposition of Ms1 ABD2 (red, PDB ID 2KRH) and COSTARS (blue, PDB ID 2L2O). Shown in the same orientation as in B as well as rotated about 90° around the horizontal axis to reveal the structural differences in the segment connecting α1 and β1 (arrow). D: Structural superposition of Ms1 ABD2 (red) on the three top hits of the DALI search in the PDB (1HR3 (green), 1SAX (blue), 1SD4 (yellow); for a list of the top 50 DALI hits see S3 Fig).

