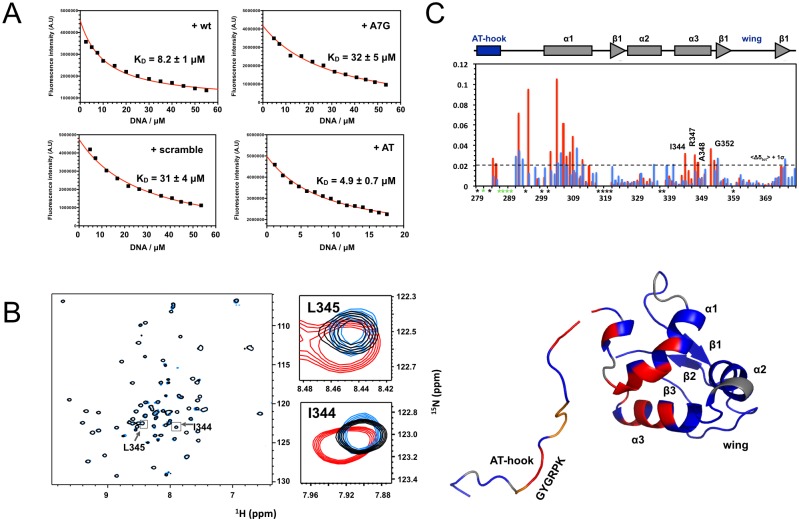
Fig 4. Details of DNA recognition by Ms1.
A: Fluorescence titrations of Ms1 270–375 with a double strand oligonucleotide representing the motif identified in the SELEX procedure (wt), a version in which the central A of the motif is replaced by a G (A7G), the scrambled version of wt (scrambled) and a version with additional AT base pairs (AT). Data points are shown in black, the fitting result in red. B: A full view and selected parts of 15N-1H HSQC spectra of Ms1 270–375 without (black), with the addition of the wt oligo (red) and the A7G mutant oligo (blue) at a 2:1 ratio. Zoomed views are shown for two residues from helix 3. C: plot of chemical shift perturbations of NMR interaction experiments of Ms1 270–375 with the wt (red) and A7G oligo (blue) against the protein sequence. The dotted horizontal line represents the 1*σ noise level. Amino acids for which assignments are missing are labelled with black stars, those that disappear in the titration are labelled with green stars. D: mapping of residues with significant chemical shift perturbations on the surface of the structure of ABD2 (red: chemical sift perturbatios > 1*σ, orange: residues that disappear in the titration, grey: reidues for which assignments are missing). For residues 294–375 our experimental ABD2 structure is used to which residues 270–294 were added based on a homology model manually created using the known structure of an AT-hook (PDB ID 2EZD).

