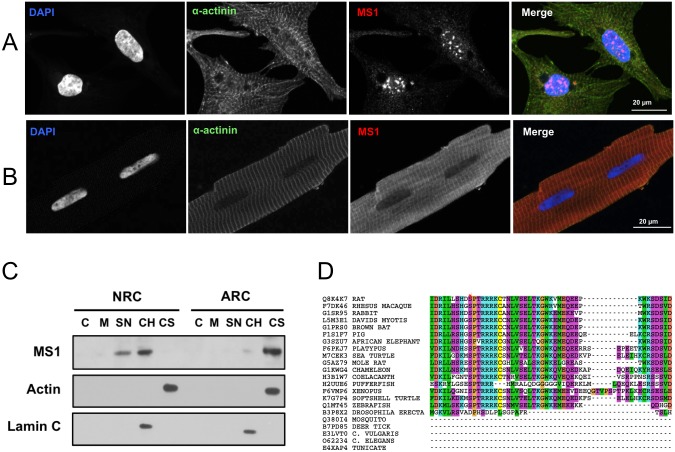
Fig 5. Subcellular localisation of Ms1.
A: Immunofluorescent detection of endogenous Ms1 in NRCs. Staining is (left-to-right) DAPI (nuclei, blue), α-actinin (green) and Ms1 (red). B: as A but in ARCs. C: western blot detection of Ms1 in subcellular fractions isolated from ARC and NRC cultures. C = cytoplasm, M = membrane, SN = soluble nuclear, CH = chromatin bound, CS = cytoskeleton. D: Sequence alignment of Ms1 in the region of the nuclear localisation signal (NLS). Phosphorylation sites identified experimentally are indicated by a star [41]. Colours and the subset of sequences are identical to those in Fig 2B. Note that Ms1 from lower organisms lack this region of the protein.

