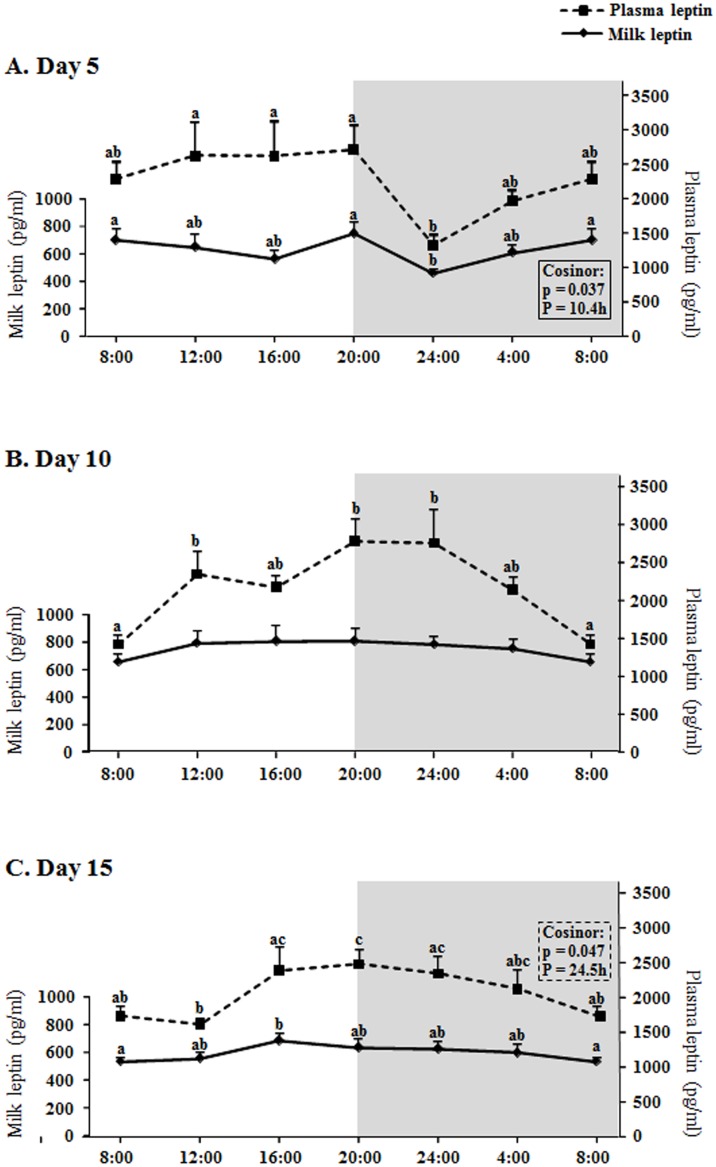
Fig 1. Circadian changes of milk and plasma leptin concentration.
A: day 5, B: day 10, C: day 15 of lactation. X axis: time points. The shading part of the graphs indicates the dark period. The result of each time-point represents the mean value ± SEM of 5 dams. ANOVA analysis was performed, followed by LSD test for post hoc comparisons (a≠b≠c) for a first general analysis of the absence of rhythmicity or the lack of uniformity. Thereafter, the cosinor method was used to detect rhythmicity. p < 0.05 was the threshold of significance. P, period of rhythmicity obtained by the cosinor analysis.

