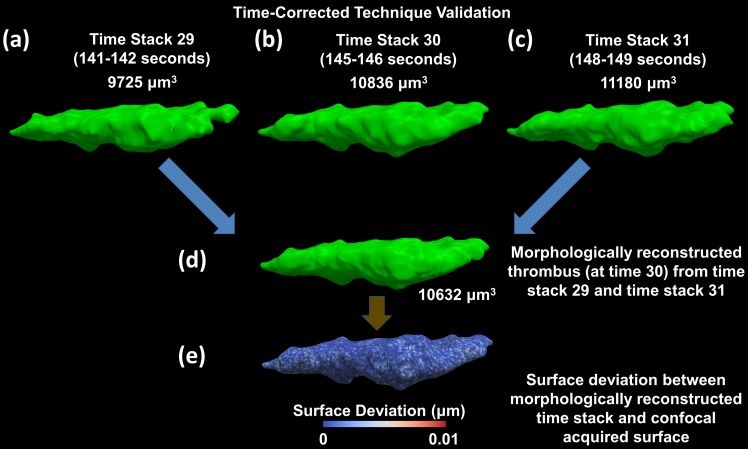
Fig 4. Validation of time-correction technique using two time stacks to reconstruct the intermediate time stack.
(a), (b), (c) Time stacks 29, 30 and 31 are all acquired using confocal microscopy and reconstructed. (d) Time stack 29 and 31 are then used to reconstruct the thrombus surface at the intermediate time stack 30. (e) The deviation between time stack 30 acquired using confocal microscopy and the morphologically reconstructed time stack 30 measured as a spatial distance (Maximum spatial deviation < 10−2 μm). Blue indicates a deviation of 0 μm, while red indicates a deviation of 10−2 μm.

