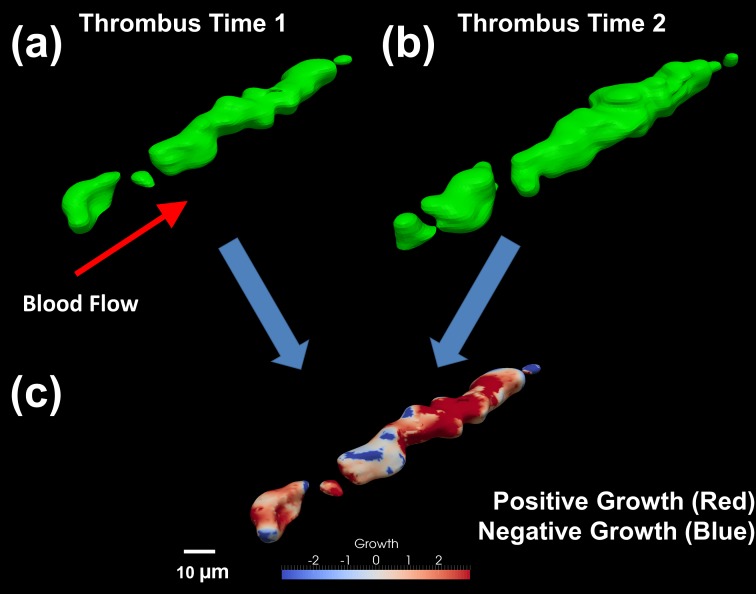
Fig 5. Determining regions of high growth or consolidation and quantifying the amount of growth between two points in time.
(a) The reconstructed thrombus surface at time 1 (100 seconds into growth phase). (b) The reconstructed thrombus surface at time 2 (135 seconds into growth phase). (c) Developed algorithm indicates which regions have grown (shown in red) and those regions which have consolidated or retracted (shown in blue). Normal vectors are calculated between the surface at time 1 towards the surface at time 2 from which a Euclidean distance is calculated to give the magnitude a particular point on the surface has either grown or consolidated between the two points in time. The normal vector magnitudes are mapped onto the surface at time 1 highlighting regions of high growth or consolidation.

