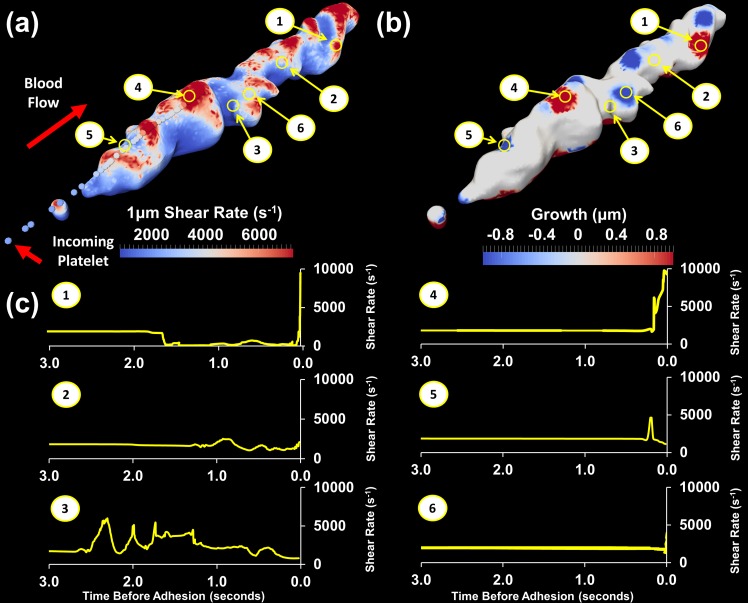
Fig 6. Thrombus growth and shear rate mapped onto original thrombus surface with shear rate experienced by individual platelets.
(a) Shear rate 1 μm above surface mapped onto original thrombus surface. Spheres represent the path a platelet landing in a high shear rate region follows, coloured by shear rate experienced (b) Original thrombus surface with regions of growth (shown in red) and regions of consolidation or embolism (shown in blue) during the last 1 second of blood flow. (c) Shear rate history over the last 3 seconds prior to adhesion for platelets adhering in very high shear rate (γlocal >10000 s-1), high shear rate (γlocal ~ 4000 s-1) and moderate shear rate (γlocal <2000 s-1) regions.

