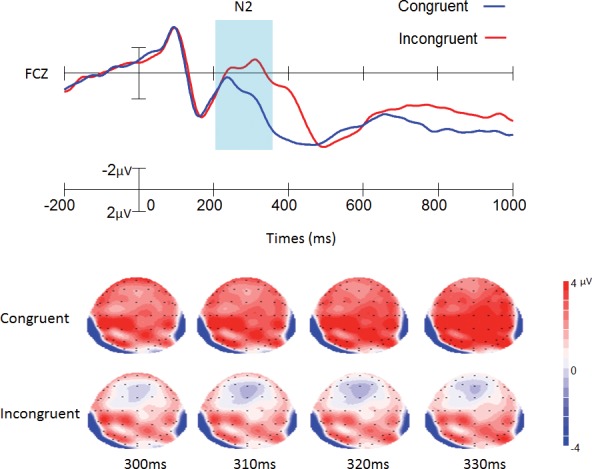
Fig 2. Grand average of ERP and topographical maps of N2.

The grand average of ERP elicited in the congruent (blue lines) and the incongruent (red lines) conditions at Cz site. The topographical maps were generated every 10 ms from 300 ms to 330 ms. Data were averaged across 42 participants for each condition.
