
Fig 4. Source localization.
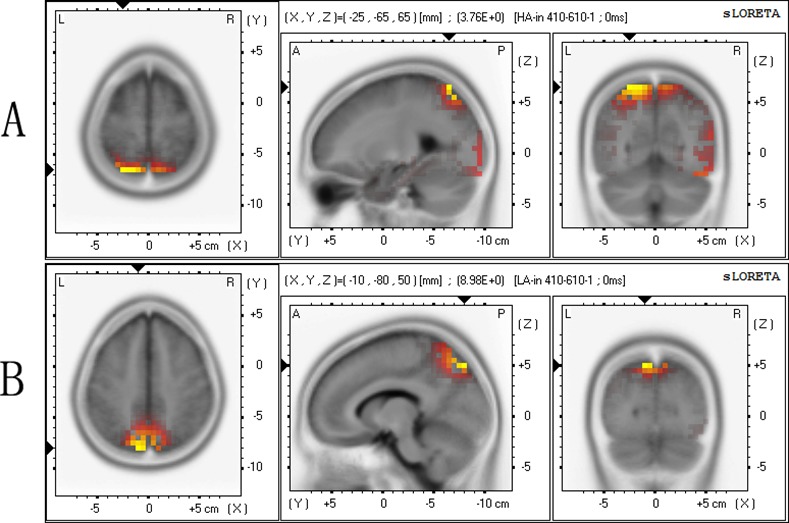
The source localization of the surface incongruent P3 amplitude sLORETA images showing the standardized current density maxima for the high-altitude group (A) and low-altitude group (B), as seen from the horizontal, sagittal, and coronal sections. Talairach coordinates (X, Y, Z) are indicated, the activity is colour-coded. Yellow colour indicates local maxima of the incongruent P3 component is in the parietal lobe (Brodmann area 7) in the high- and low-altitude groups.