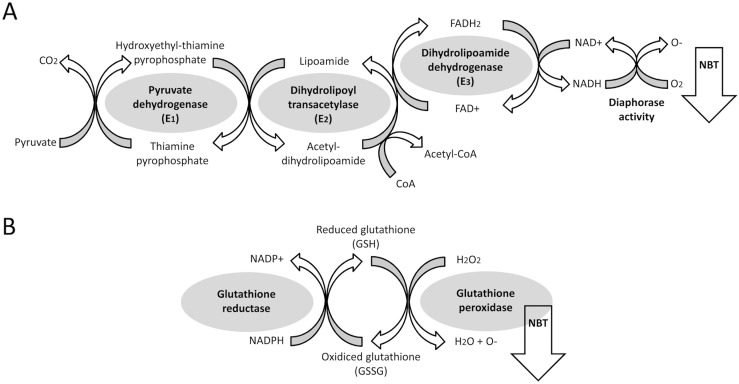
Fig 9. Scheme showing the enzymatic reactions that catalyze the pyruvate dehydrogenase complex, including pyruvate dehydrogenase activity and diaphorase activity of DLD (A) as well as the glutathione reductase/peroxidase activity (B).
NBT staining is proportional to O- production from redox activity.

