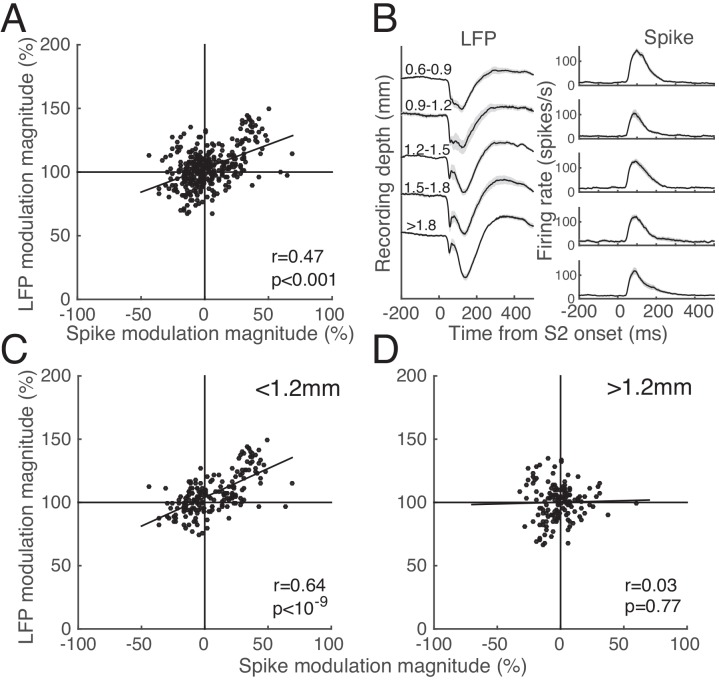
Fig 7. Relationship between spike and LFP modulation.
A. Scatter plot showing the percentage changes in spike activity and RMS LFP power in the S1-S2 sequence relative to the S2-alone condition for 330 stimulus conditions (11 SOA conditions X 30 sites). They are positively related as indicated by the Pearson correlation coefficient and its p-value inside the panel. B. LFP (left) and corresponding spike density (right) traces from all 62 sites in which S2 alone was tested, averaged for five depth groups divided into depth segments of 300μm, measured from the surface of the dura. The deepest trace (bottom) includes all recording sites below 1800μm from the dura. The shading represents ±1 SE. C, D. Relationship between spike and LFP modulation subdivided into two depth groups, upper (C, <1.2mm) and lower (D, >1.2mm). Same convention as A.

