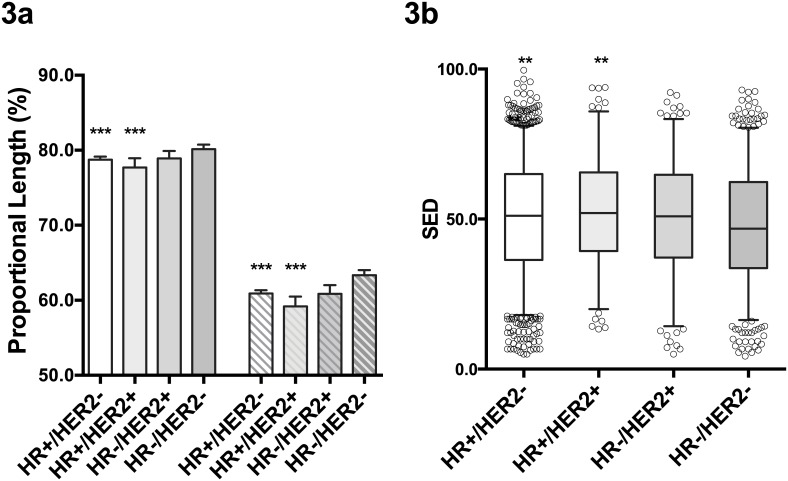
Fig 3. Three-dimensional tumor diameters according to the molecular subtypes.
The relative lengths of b (2nd largest pathologic diameter) and c (3rd largest pathologic diameter) according to the molecular subtypes of breast cancer are shown in 3a. The bars represent the relative lengths of the b (solid bars) and c (shaded bars) in comparison to the largest diameter of the tumors (a). *** P<0.001 compared to HR-/HER2-. The distribution of the SED (spheroid-ellipsoid discrepancy) according to the molecular subtypes of breast cancer is shown in 3b. Bars represent the 5–95 percentiles. ** P<0.01 when compared to HR-/HER2- tumors. HR: hormonal receptor, HER2: HER2 overexpression.

