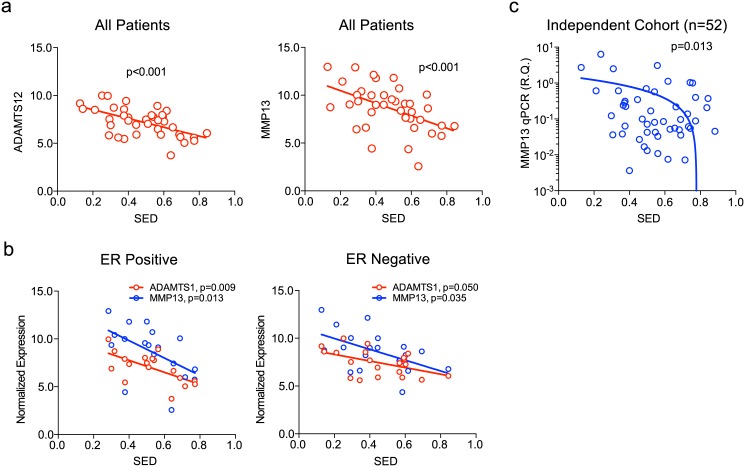
Fig 5. Gene expression profiles associated with breast cancer’s spatial growth measured by SED (spheroid-ellipsoid discrepancy).
The scatter plots for MMP13 and ADAMTS12 are shown in (a) and the correlation was stratified according to the hormonal receptor status (b). The results of the qRT-PCR against MMP13 and the SED are shown in Fig 5c. RQ: relative quantification.

