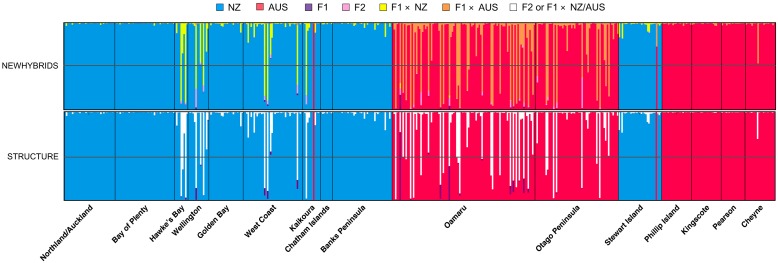
Fig 5. Individual assignment to genetic clusters and hybrid ancestry as determined by STRUCTURE assignment test (bottom plot) and NEWHYBRIDS (top plot).
Sampling locations are separated by black vertical lines. Individuals are represented by vertical bars where the colour represents the posterior probability of ancestry of being NZ lineage (blue), AUS lineage (red), a first generation hybrid (F1; purple), a second generation hybrid (F2; pink), a backcross between a F1 and NZ lineage individual (yellow), a backcross between a F1 and AUS lineage individual (orange) or a F2/backcross with either lineage (white; for STRUCTURE plot only). The grey horizontal line indicates 50% posterior probability threshold.

