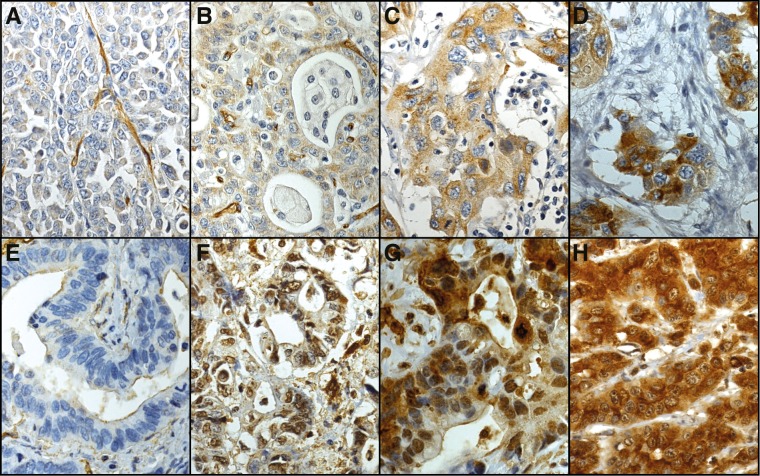
Fig 1. Representative images of HPA2110 and HES9 staining representing gastric cancer tumors with negative (A, E), weak (B, F), moderate (C, G), and strong (D, H) staining in a varying proportion of tumor cells.
Images A-D stained with the polyclonal HPA2110 antibody and E-H with the monoclonal HES9 antibody. Original magnification 40x.

