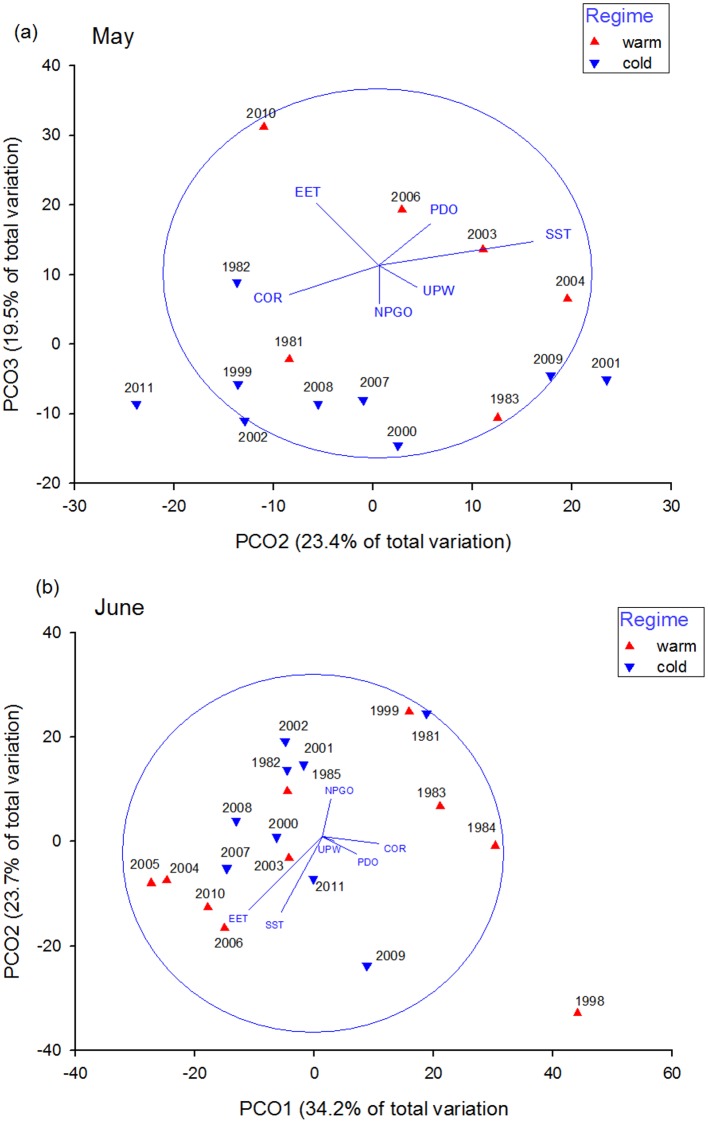
Fig 2. Principal Coordinate Analysis (PCO) of juvenile Chinook salmon diet composition in May (a) and June (b).
Each data point on the PCO plot represents the average annual diet composition of juvenile Chinook salmon for May and June. The vectors show the direction and relative strength of the environmental variables examined and the circle represents equilibrium.

