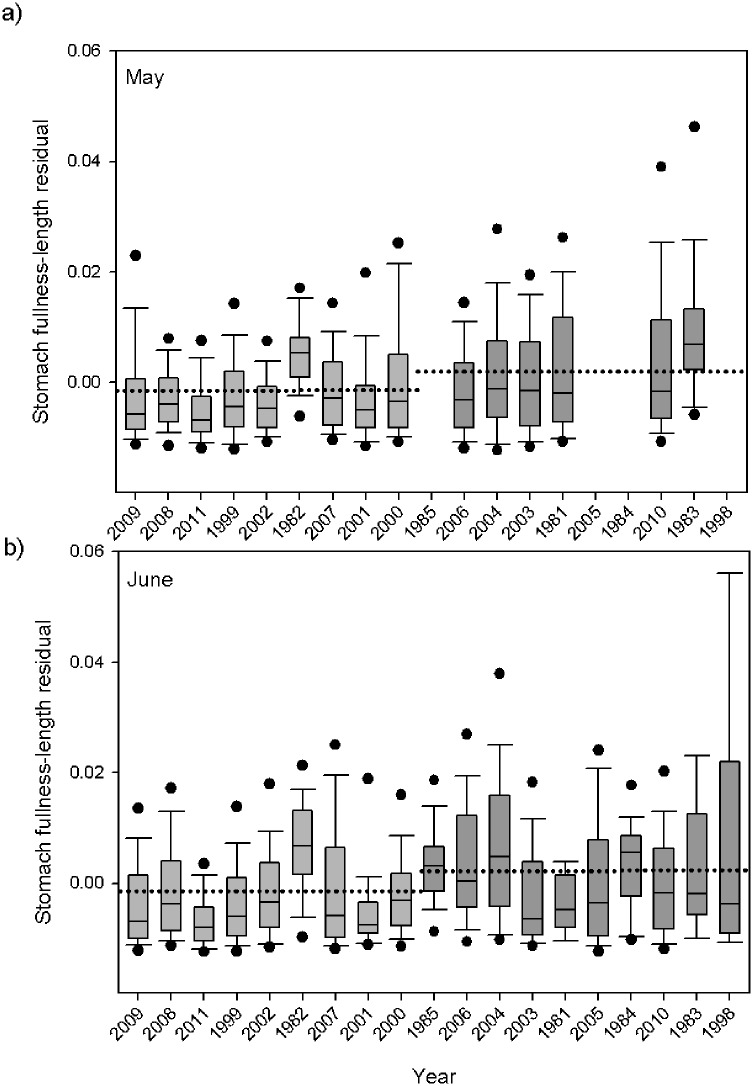
Fig 3. Average annual index of stomach fullness for May (a) and June (b) of juvenile yearling Chinook salmon.
Shown are boxplots with the median (lines in boxes), 25th and 75th percentiles (lower and upper ends of boxes), 10th and 90th percentiles (error bars), and 5th and 95th percentiles (points) for each year. Light grey bars designate cold years, and darker grey bars designate warm years, with dotted line representing regime median.

