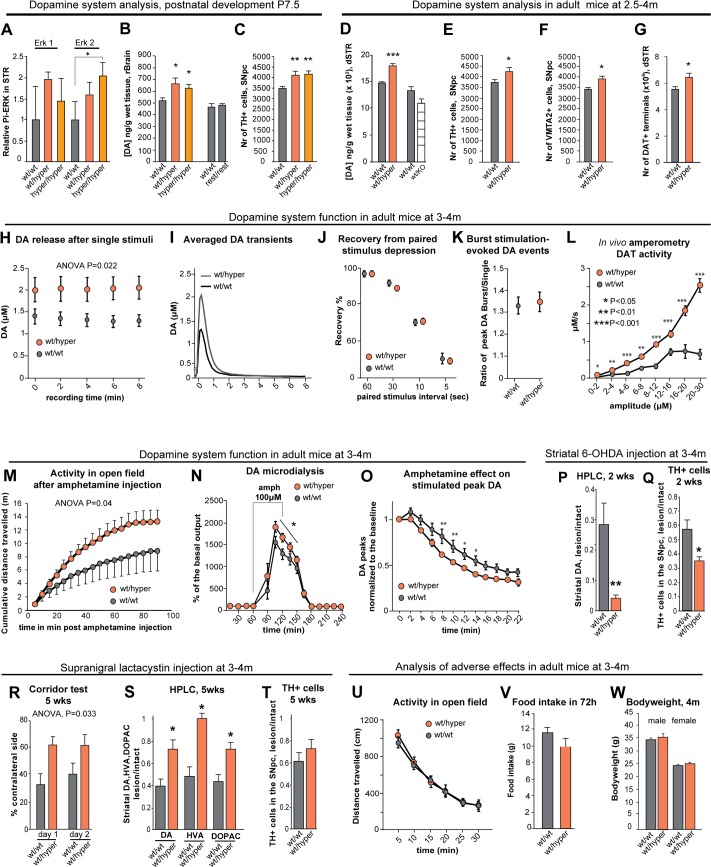
Fig 4. Increased endogenous GDNF expression affects the development and function of the nigrostriatal dopaminergic system.
(A) Levels of phosphorylated ERK2 at P7.5 in the striatum of Gdnf wt/wt, Gdnf wt/hyper and Gdnf hyper/hyper mice. N = 5 mice/group; ERK was used for normalization. (B) HPLC analysis of DA levels in the rostral brain; N = 5–8 mice/group (F = 7.44, P = 0.016). (C) Quantification of tyrosine hydroxylase (TH)-positive (a marker of DA neurons) cells in the SNpc; N = 6–8 mice/group (F = 7.44, P = 0.0048). (D) HPLC analysis of DA levels in the dSTR; N = 11 for Gdnf wt/wt, 8 for Gdnf wt/hyper mice/group (P = 0.000164). HPLC analysis of DA levels in the dorsal striatum of Gdnf 3’UTR wt/wt and Gdnf wt/KO mice; N = 6 mice/group. (E-F) The number of TH-positive (E; N = 8 Gdnf wt/wt, N = 7 Gdnf wt/hyper; P = 0.025) and VMAT2-positive neurons (F; N = 7 Gdnf wt/wt, N = 7 Gdnf wt/hyper; P = 0.016) in the SNpc. (G) The number of DAT+ varicosities (N = 9 Gdnf wt/wt, N = 7 Gdnf wt/hyper; P = 0.042) in the dSTR. (H-K) Cyclic voltammetry analysis of acute striatal slices (see also S3J Fig); N = 5–7 mice/group with 1–3 slices per mouse. (H) DA release in response to electrical stimulation [two-way repeated measures ANOVA, F (1,29) = 5.866]; (I) Averaged traces of DA events. (J) Short-term depression of striatal DA release after prior DA exocytosis, shown as percent of the first DA release. (K) The ratio of DA release after a single stimulus and after a 5 pulse burst at 20Hz. (L) In vivo amperometry following intrastriatal DA injection reveals that dopamine transporter (DAT) activity in Gdnf wt/hyper mice is dependent on the concentration of DA; N = 4 mice/group (F = 47.931). (M) Locomotor activity after an injection of amphetamine (1 mg/kg, i.p.); N = 9–10 mice/group (F = 4.386, P = 0.04). (N) In vivo microdialysis analysis of extracellular striatal DA levels; amphetamine was applied as indicated by the horizontal bar; N = 9 mice/group. (O) Cyclic voltammetry analysis shows that amphetamine (5 μM) depletes stimulated DA release faster in the striata of Gdnf wt/hyper mice compared to Gdnf wt/wt mice; two-way repeated-measures ANOVA reveals an effect of time (P<0.0001) and genotype (P = 0.031), as well as an interaction between time and genotype (P = 0.049); N = 6 mice/group with 1–3 slices per mouse. (P-Q) Analysis of a 6-OHDA induced PD model. (P) Quantification of DA in the dSTR 2 weeks after striatal 6-OHDA injection, relative to the intact side (N = 12 Gdnf wt/wt; N = 10 Gdnf wt/hyper), (F = 40.62, P = 0.00549, Students t-test). The intact and lesioned side differed significantly (P = 2.71×10⁻¹⁵). (Q) Quantification of TH-positive neurons in the SNpc 2 weeks after striatal 6-OHDA injection, relative to the intact side, (F = 7.04, P = 0.0143, Students t-test). The intact and lesioned side differed significantly (P = 3.00×10⁻¹¹). (R-T) Analysis of a lactacystin-induced PD model. (R) The percentage of sugar pellet retrievals from the contralateral side in the corridor test; N = 5–7 mice/group (F = 6.087, P = 0.033). (S) Quantification of DA, DOPAC, and HVA in the dSTR 5 weeks after supranigral lactacystin injection, relative to the intact side; N = 5 Gdnf wt/wt, N = 7 Gdnf wt/hyper; P = 0.046 for DA, P = 0.015 for DOPAC, P = 0.011 for HVA. The intact and lesioned side differed significantly; P = 0.00016 for DA, P = 0.015 for DOPAC, P = 0.010 for HVA. (T) Quantification of TH-positive neurons in the SNpc 5 weeks after lactacystin injection, relative to the intact side; N = 4 Gdnf wt/wt, N = 7 Gdnf wt/hyper; P = 0.236. The intact and lesioned side differed significantly (P = 0.00029). (U-W) Evaluation of side effects associated with intracranial ectopic GDNF expression. (U) Spontaneous locomotor activity in an open field; N = 31–34 mice/group. (V) Food intake by adult mice during a 72-hour period; N = 10 mice/group. (W) Body weight of adult mice; N = 9–34 mice/group. Abbreviations: DA, dopamine; DOPAC, 3,4-dihydroxyphenylacetic acid; HVA, homovanillic acid; dSTR, dorsal striatum; SNpc, substantia nigra pars compacta.

