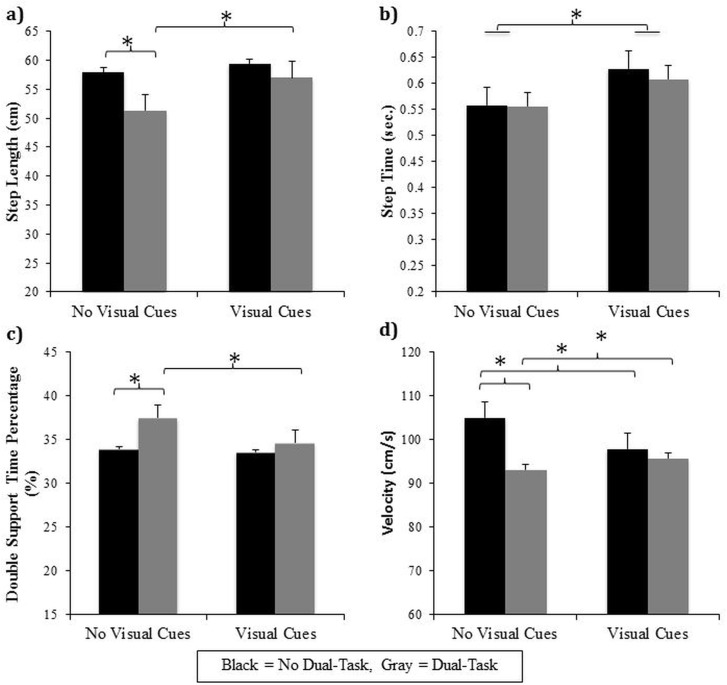
Fig 2. Significant gait interactions in Experiment #1 between dual-task and visual cues: Graphical illustration of a) step length, b) step time, c) double support time percentage, and d) velocity collapsed across groups when participants performed either the “dual-task” (gray) or “no dual-task” (black) conditions while walking on either the “no visual cues” pathway or “visual cues” pathway.
* represents a significant difference at the p<0.05 level.

