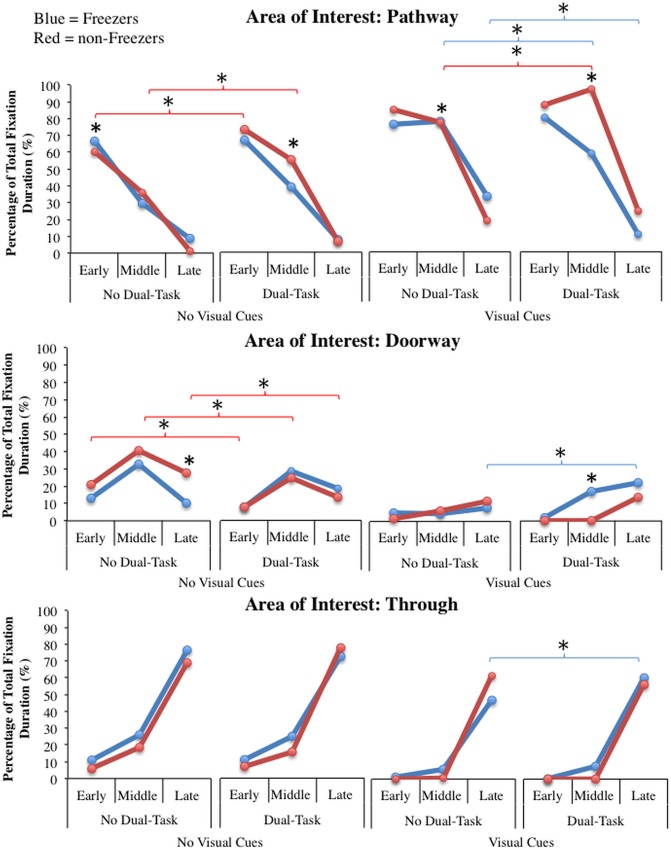
Fig 5. Significant gaze interactions in Experiment #1 between group, dual-task, visual cues, phase, and area of interest: Graphical illustration of the percentage of total fixation duration towards the pathway (top graphs), doorway (middle graphs) and through the doorway (bottom graphs) of the freezers (blue) and non-freezers (red) in the early, middle and late phases of walking toward and through the narrowed doorway in the “dual-task” or “no dual-task” conditions on either the “no visual cues” pathway or the “visual cues” pathway.
* represents a significant difference at the p<0.05 level uncovered with Fisher’s LSD analysis. Blue parenthetical lines represent differences within the freezer group, and red parenthetical lines represent differences within the non-freezer group.

