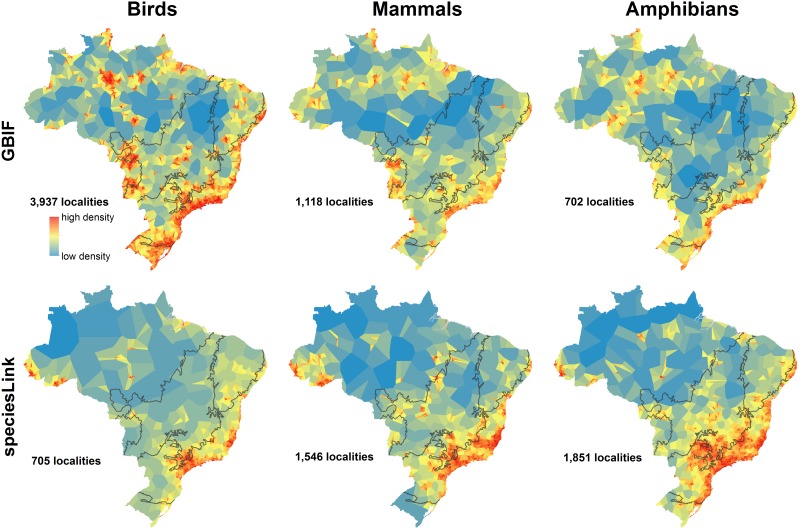
Fig 3. Thiessen polygon networks to represent sampling density.
Maps derive from data from the Global Biodiversity Information Facility (GBIF) and from Brazil’s speciesLink site. Polygon colors correspond to their size and use a Jenks natural breaks grouping for the color stretch. Gray lines delimit biomes.

