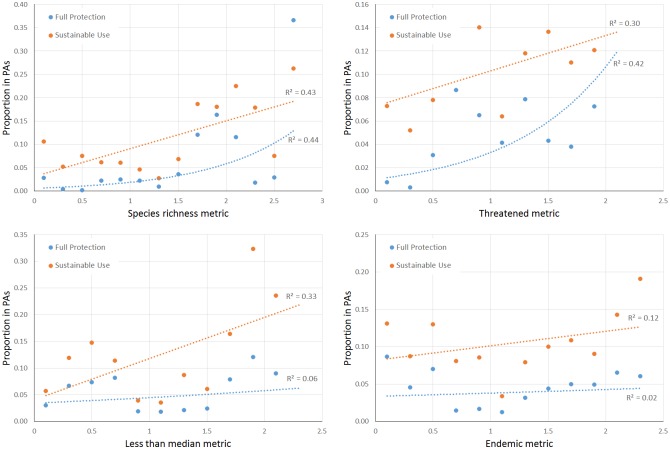
Fig 5. Rates of protection versus multi-taxa metrics of biodiversity.
Data points correspond to intervals of 0.2 on the potential 0 to 3 scale of each biodiversity metric. For example, a point at 0.5 represents all of the areas in Brazil that had a value between 0.4 and 0.6 for that particular metric. Lines represent regressions. PAs—Protected Areas.

