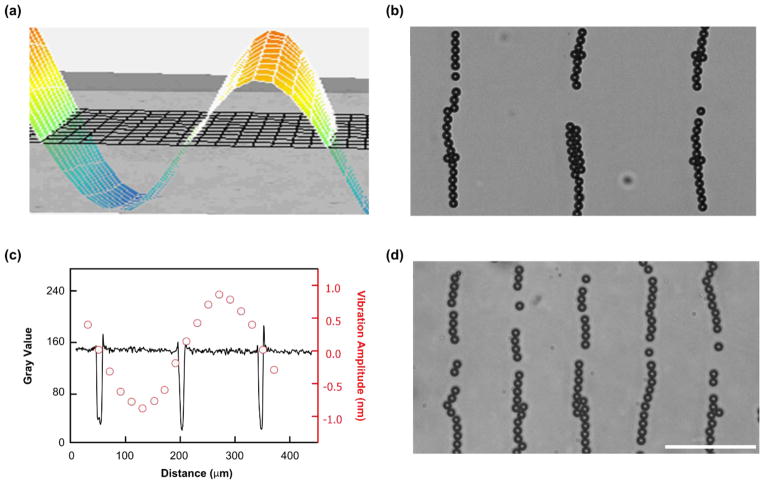
Fig. 2.
Characterization of local SSAW transmission. (a) 2D map of the transversal vibrations on the LiNbO3 substrate with a pair of parallel IDTs using a wavelength of 300 μm. The red and blue colors indicate the displacement antinodes on the substrate, and the green color indicates the displacement nodes. (b) 10 μm polystyrene particles were patterned into parallel lines with an interval distance of 150 μm by coupling 1D SSAWs with a wavelength of 300 μm. (c) The plot of spatial distribution of displacement node on the substrate (red circles) and particles patterning distribution in the disposable device (black curve) match with each other. The red circles show the distribution of the vibration amplitude, and the locations with a vibration amplitude of approximately zero indicate the displacement nodes on the substrate. The black curve indicates the location of patterned particles. (d) By using the same disposable device, 10 μm polystyrene particles were patterned into parallel lines with an interval distance of 75 μm by coupling 1D SSAWs with a wavelength of 150 μm. Scale bar: 100 μm.

