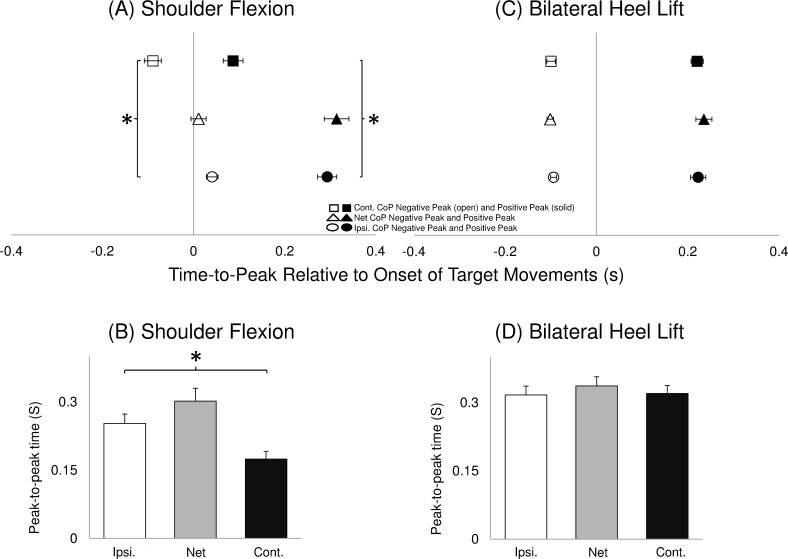
Fig 2. Mean (±SEM, N = 9) time for the first negative and first positive peak of AP direction across the four baseline sessions of CoP displacement during unilateral shoulder flexion (A) and bilateral heel lift (C). The time for negative (open symbols) and positive (solid symbols) peaks are illustrated for the ipsilateral (circles), net CoP (triangles) and contralateral (squares). The symbol “*” indicates significant earlier peak time of contralateral compared with the ipsilateral CoP. Time duration between two peaks of AP direction across the four baseline sessions of CoP displacement during unilateral shoulder flexion (B) and bilateral heel lift (D).
Ipsilateral (open bars), net CoP (grey bars) and contralateral (solid) are illustrated. The symbol “*” indicates significantly longer time of the ipsilateral side compared with the contralateral side is illustrated.

