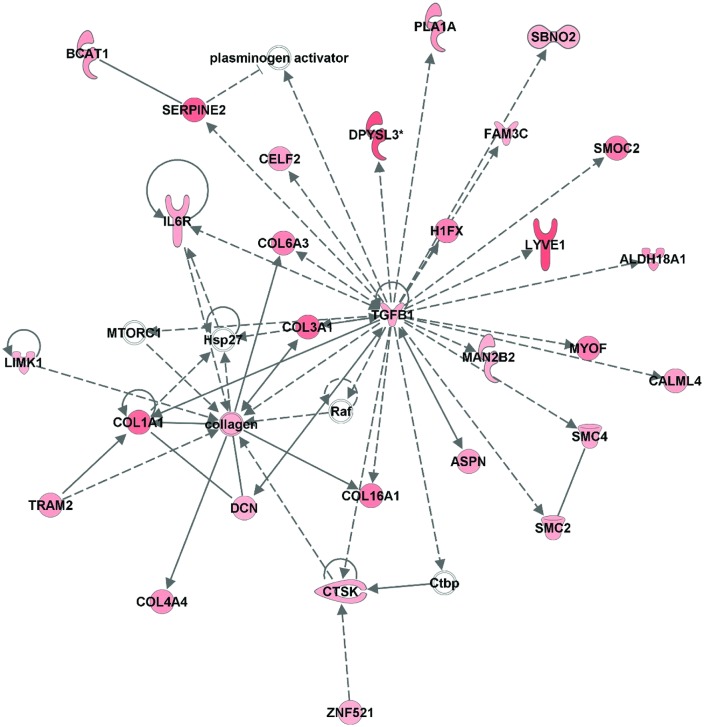
Fig 4. Top scoring network inclusive of up-regulated genes (score = 47) in LOCK vs RUN.
Nodes represent genes/molecules. Shading is proportional to fold change size (red: up-regulated). Direct and indirect relationships are denoted with solid and dashed lines, respectively. White nodes denote network members that were not altered in the network. Lines ending in an arrow or blunt end indicate known direction of molecular activation or inhibition, respectively. Different shapes of genes represent different gene functions.

