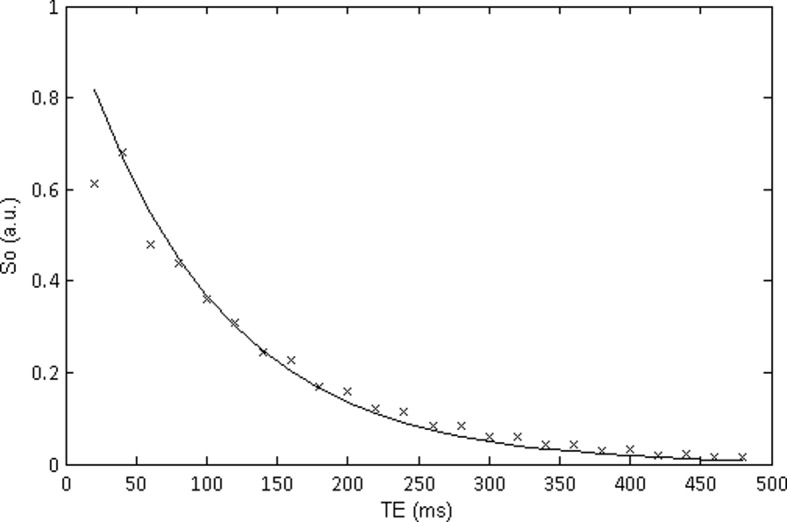
Fig 1. Illustration of a EPG derived curve with an FA of 120° (x) and correct 180° FA (line) for a T2 = 100ms, T1 = 3000ms, ESP = 20ms and ETL of 24.

It can be seen that due to the incorrect FA the first echo point is lower than that of the second and the signal seems to oscillate between odd and even echoes.
