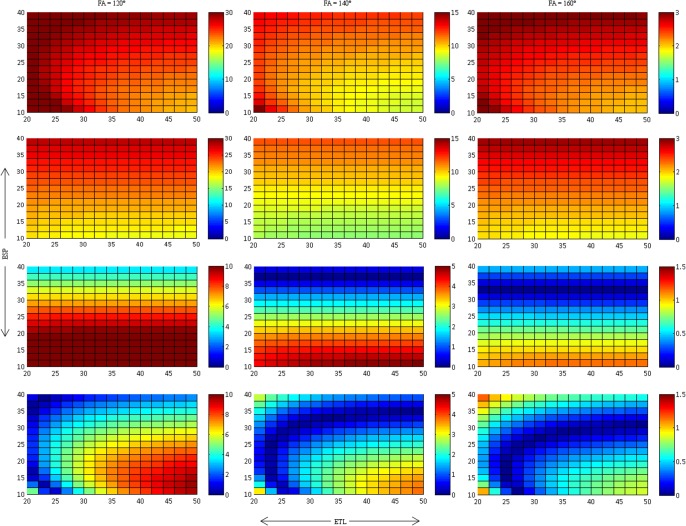
Fig 3. Relative T2 deviation, dT2 (in %), for method 1 (first row), method 2 (second row), method 3 (third row) and method 4 (forth row).
These results are presented for 3 different FA. It is seen that T2 becomes longer as the FA decreases. Closer approximation to the actual T2 are seen when Eq 2 is used and the first point is excluded. Please note that the scales of dT2 are not uniform provide maximum dynamic range for the different ETL and ESP.

